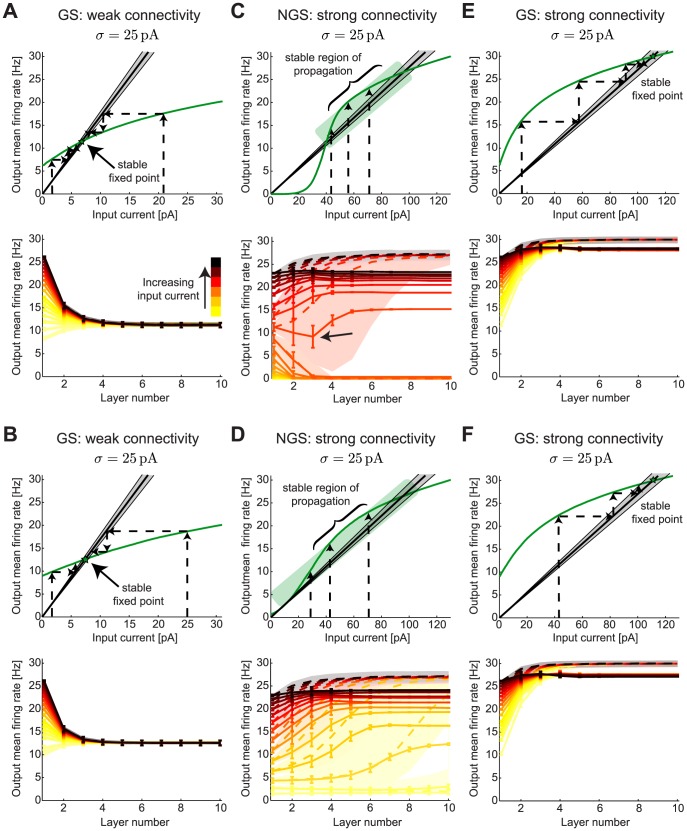
Figure 6. Firing rate propagation through networks of gain-scaling and nongain-scaling neurons.
A,B. Top: The  –
– curves (green) for GS neurons (
 pS/µm2 and
  pS/µm2) at two levels of noise,
  pA (low noise) and
  pA (high noise). The linear input-output relationships from the mean field (black) predict how the mean output firing rate of a given network layer can be derived from the mean input current into the first layer with the standard deviation of the prediction shown in gray. Dashed arrows show the iterated map dynamics transforming different mean input currents into a single output firing rate determined by the stable fixed point (green star). Bottom: The network mean firing rates for a range of mean input currents (to layer 1) as a function of layer number, with a clear convergence to the fixed point by layer 5. The results from numerical simulations over 10 second-long trials are shown as full lines (mean
  from 2000 neurons in each layer) and mean field predictions are shown in dashed lines with a shaded background in the same color (for each different input) illustrating the standard deviation of the prediction. Other network parameters: connection probability
  , synaptic strength
  and range of mean input currents 0–22 pA. C,D. Same as A,B but for NGS neurons (
 pS/µm2 and
  pS/µm2) with stronger synaptic strength
  and range of mean input currents 0–70 pA. The network dynamics show a region of stable firing rate propagation (green box) where the
  –
– curve behaves like it is tangent to the input-output line for a large range of mean input currents (to layer 1). The size of the region increases with noise (until
  pA). Bottom panels show the transmission of a range of input firing rates across different layers in the network. The arrow denotes a case where the firing rate first decreases towards 0 and then stabilizes. E,F. Same synaptic strength as C,D but for GS neurons (
 pS/µm2 and
  pS/µm2). Bottom panels show the convergence of firing rates to a single fixed point similar to the weakly connected GS network in A,B. As for the NGS networks in C,D, the mean field analysis predicts convergence to a slightly higher firing rate than the numerical simulations.

