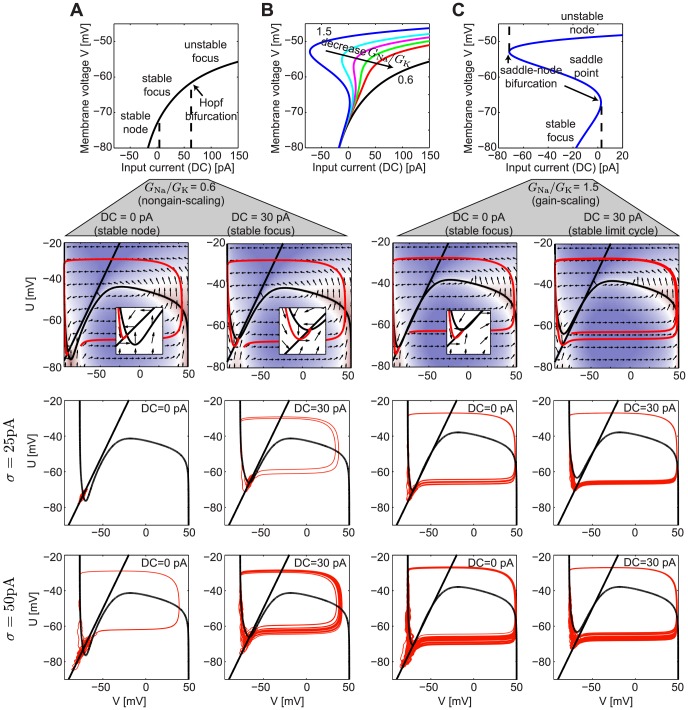
Figure 8. Analysis of the reduced Mainen model.
A. Top: Fixed points and their stability for the dynamics of a NGS neuron with  pS/µm2 and
  pS/µm2 (
 ) as a function of the input current DC. Bottom: The phase planes showing the nullclines (black) and their intersection points (fixed points) together with the flow lines indicated by the arrows. A single trajectory is shown in red. The inset shows a zoomed portion of the phase plane near the fixed point. Below we show trajectories for two values of
  and two DC values. B. The fixed points for different ratios
  , while keeping
  pS/µm2 and varying
  , as a function of the DC. C. Same as A but for a GS neuron with
  pS/µm2 and
  pS/µm2 (
 ). Note that the abscissa has been scaled from A and B.

