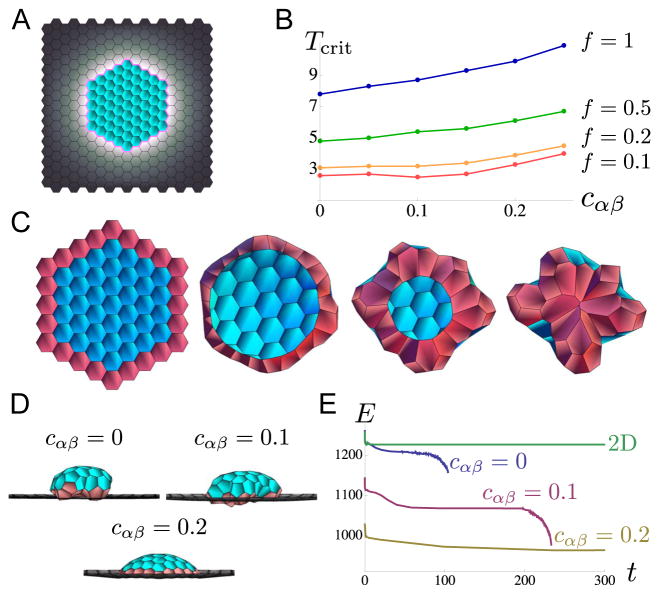
Figure 6. An example of an intrinsically 3d event, budding, simulated using our version of the vertex model.
A. Initial configuration of cells in simulation; a small perturbation in the z direction is given to allow out-of-plane motion; the domain of cells is fixed at its equilibrium size at the boundaries. Color-coding denotes vertex model parameter patterning: blue cells have dimensionless parameter values aα = a = 1, bα = b = 0.1, and σij = σ = 1; gray cells have aα = fa = f, bα = fb = f0.1, and σij = fσ = f; pink line indicates edges with σij ≈ T ≥ 1 with some noise (see discussion in the main text). The ring of high tension at the boundary between patch and non-patch cells eventually causes the patch to “pinch off”. B. Plotted are the critical tension Tcrit as a function of the bending parameter cαβ required to cause the patch of cells to pinch off. The value Tcrit is explored for f = 1 (blue), f = 0.5 (green), f = 0.2 (orange), and f = 0.1 (red). It is clear that Tcrit is lower for smaller values of f, and Tcrit is larger for larger values of cαβ since tissues averse to bending will require larger tensions to pinch off. C. Frames from the simulation with parameters in part A, setting f = 0.5, T = 5.5 and cαβ = 0.1, viewed from beneath the dome of cells (Movie S10); the row of patch cells initially contacting the non-patch cells are colored pink for easy identification. It is clear that several intercalations occur between initial and final configurations at the patch edge due to the presence high tension there. D. Final steady states of the system viewed from the side with parameters in part C except for cαβ which is varied as cαβ = 0, 0.1 and 0.2. While for cαβ = 0, 0.1, the patch of cells pinches off (Movies S9–S10), for cαβ = 0.2, this does not occur (Movies S11–S12). E. Total energy E plotted as a function of time for cells time-evolved from an initial configuration, for cαβ = 0, 0.1, 0.2 and for a system confined to 2d (z component is 0). While for cαβ = 0, 0.1 the energy drops sharply when the patch of cells pinch off, for cαβ = 0.2 and for the cells confined to 2d, the energy equilibrates to a stable value. Note that the final stable energy E is lower for the cases where cells are allowed to move in 3d than for the case where the cells are confined to 2d. Note also that the final pinched-off configuration for the cαβ = 0 and cαβ = 0.1 cases are not equilibrium states.

