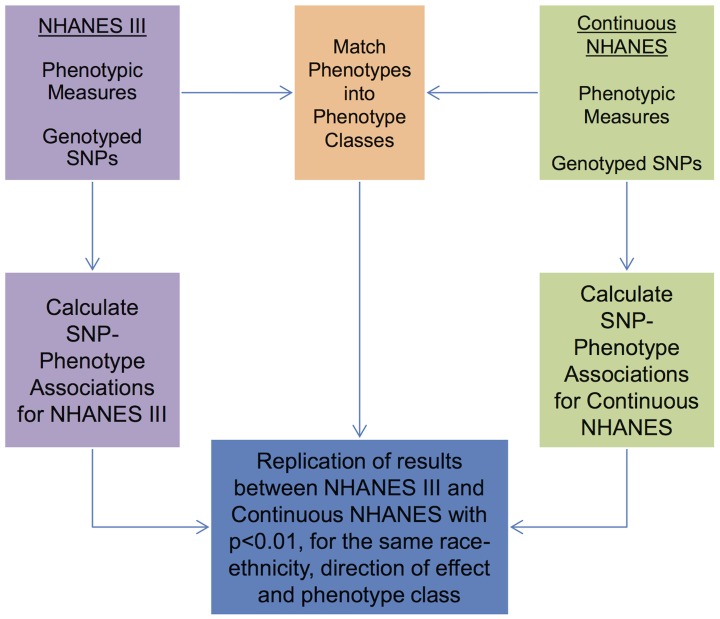
Figure 1. Overview of the approach for this study.
Genotypic and phenotypic data were collected in NHANES III and Continuous NHANES. The phenotypes for the two studies were matched into phenotype classes. Comprehensive associations were calculated for the genotypes and phenotypes for each survey independently. The results that were found in both surveys, with p<0.01, for the same phenotype-class, and race-ethnicity, and same direction of effect, were maintained for further inspection in this study.

