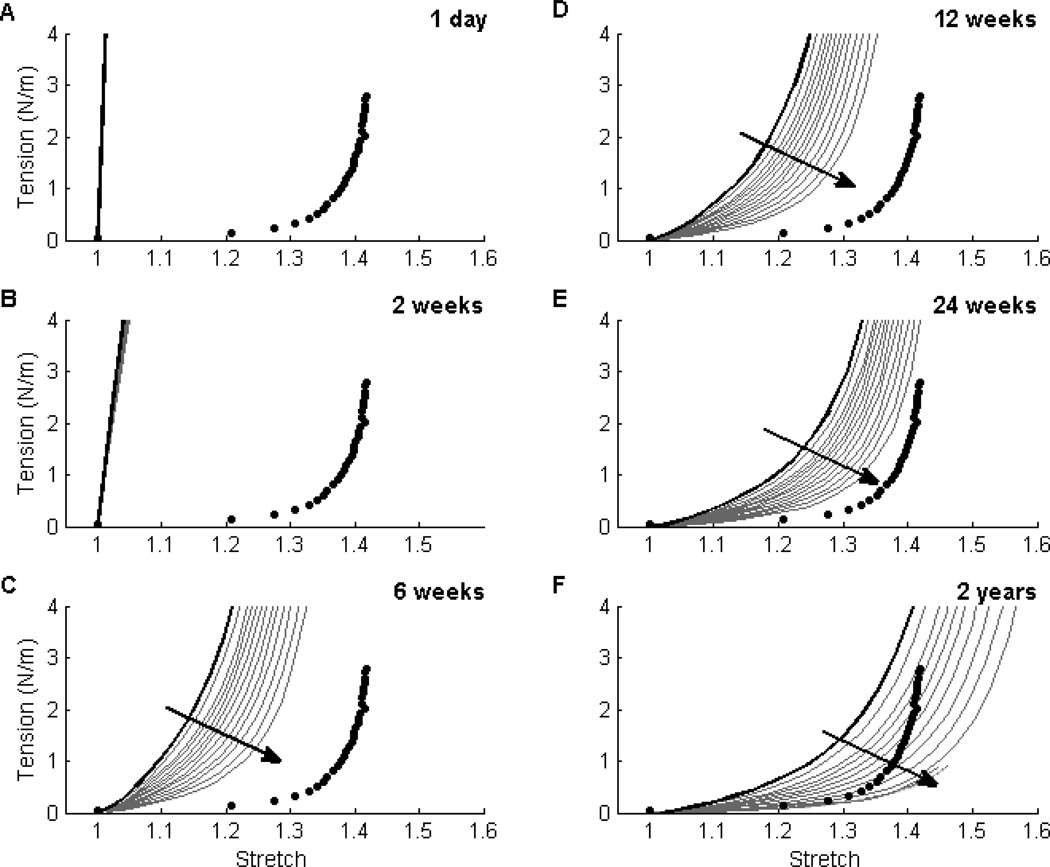
Figure 2. Effect of Fiber Diameter ω* on Material Behavior.
Evolving circumferential tension-stretch behaviors for simulated TEVGs (solid lines) at 1 day (Panel A), 2 weeks (Panel B), 6 weeks (Panel C), 12 weeks (Panel D), 24 weeks (Panel E), and 2 years (Panel F) post-implantation are contrasted against mean experimental results for the native murine inferior vena cava (solid symbols; [41]). The solid black curve shows predicted results (cf. [35]) that correlated well with an actual experimental case (cf. [4,5]) for an initial normalized fiber diameter ω* = 1.4 and scaffold porosity ε = 80%; the solid grey curves show predicted results for ω* ∈ [0.01,1.4] at a porosity of 80%. Reducing ω* (indicated by the direction of the dark arrow) decreased the magnitude of the inflammatory response and subsequently resulted in more distensible TEVGs. This trend was preserved across porosities of interest (60 to 95%), but the effect of ω* increased with increasing porosity. Finally, note that an intermediate range of ω* ∈ [0.5,1.0] resulted in simulated TEVGs having a compliance at 2 years that best approached that of the native vein (Panel F).

