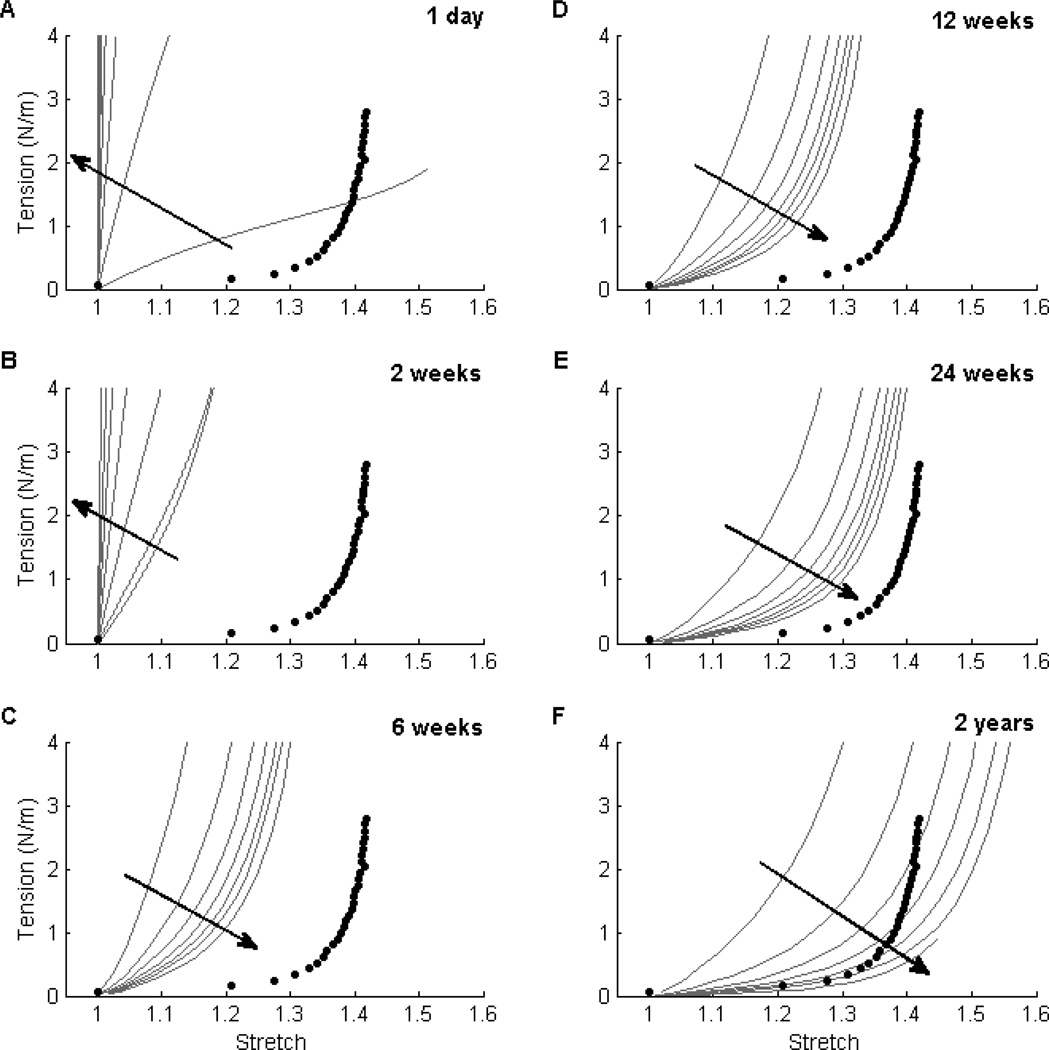
Figure 3. Effect of Porosity ε on Material Behavior.
Similar to Figure 1, evolving circumferential tension-stretch behaviors for simulated TEVGs (solid lines) at 1 day (Panel A), 2 weeks (Panel B), 6 weeks (Panel C), 12 weeks (Panel D), 24 weeks (Panel E), and 2 years (Panel F) post-implantation are contrasted against mean experimental results for the native murine inferior vena cava (solid symbols). The grey curves show results for initial scaffold porosity ε ∈ [60%, 95%] for a fixed initial normalized fiber diameter ω* = 0.6. Noting that the polymer degraded fully by 4 weeks, there were dramatic changes between 2 and 6 weeks: the earlier times revealed strong effects of porosity on polymer stiffness (e.g., Panel B) while the later times showed subsequent effects on matrix production (e.g., panel C). Note, too, that smaller values of ε (indicated by the direction of the dark arrow) resulted in more distensible TEVGs at later times (e.g. Panel F). This trend was preserved across a range of normalized fiber diameters of interest. For the representative ω* = 0.6, the results suggested that a range of porosities ε ∈ [75%, 85%] resulted in a 2-year compliance of the simulated TEVG that approached that of the native vein (Panel F).

