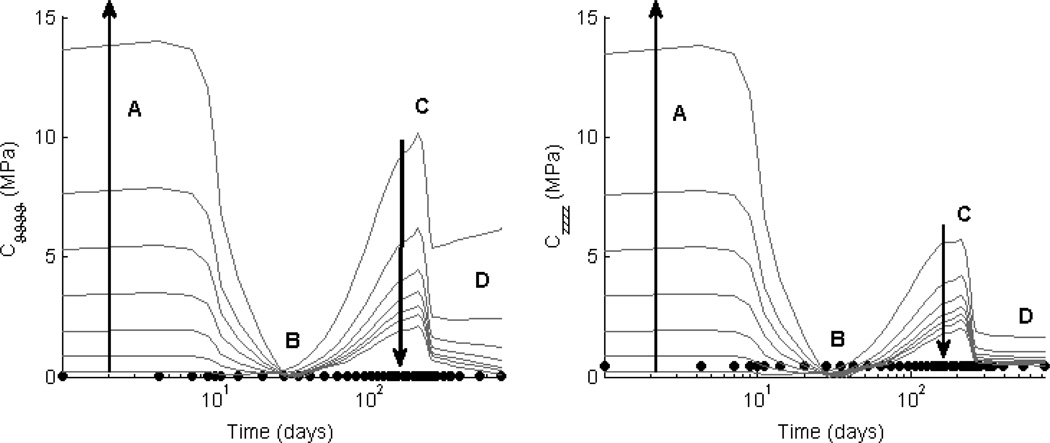
Figure 5. Effect of porosity ε on Stiffness.
Values of circumferential (left) and axial (right) linearized stiffness, computed at in vivo values of circumferential and axial stretch, are contrasted between the simulated TEVGs (solid lines) and native inferior vena cava (solid symbols). The grey lines show results for initial scaffold porosity ε ∈ [60%, 95%] and a representative normalized fiber diameter ω* = 0.6. Decreasing the porosity (indicated by the direction of the dark arrow) increased the initial contribution of the scaffold (phase A) and indirectly decreased matrix production, thus resulting in a decreased peak (C) and plateau values (D) of linearized stiffness. Note, in particular, that ε ∈ [75%, 85%] decreased the overall variation in stiffness as the TEVG evolved, thus suggesting that a reduced range of scaffold properties should be explored experimentally.

