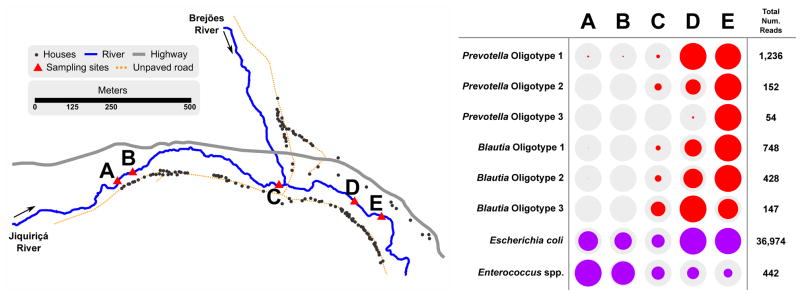
Figure I.

Traditional indicators and Prevotella and Lachnospiraceae oligotypes demonstrating human fecal pollution inputs. River sampling transect in the Jiquiriçá River and increasing human Prevotella and Lachnospiraceae oligotypes with increasing residential density. Map shows residential structures along the river transect. Colored circles in the table are proportional to the relative abundance of human Prevotella or Lachnospiraceae oligotypes (red) or the relative abundance of sequences classified as E. coli or Enterococci sp. as a measure of overall fecal pollution (purple). Data were originally reported in Koskey et al. [111].
