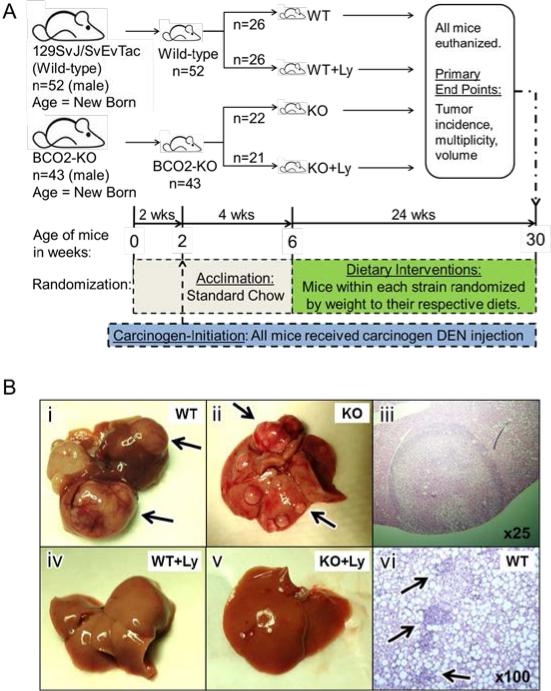
Figure 1. Study design, gross and histopathology of liver tumor and inflammation.
Panel A. Schematic for study design. Panel B: Representative picture or light micrograph of livers from WT, WT+Ly, KO or KO+Ly: B-i, liver from WT with tumors (arrows). B-ii, liver from KO with tumors (arrows). B-iii, H&E stained liver tumor at 25X. B-iv, liver from WT+Ly. B-v, liver from KO+Ly. B-vi, H&E stained liver from WT with inflammatory cell infiltration (arrows) at 100X. BCO2, beta-carotene-9’,10’-oxygenase; BCO2-KO, BCO2 knockout; DEN, diethylnitrosamine; HFD, high fat diet; KO, knockout on HFD; Ly, lycopene; WT, wild-type on HFD.

