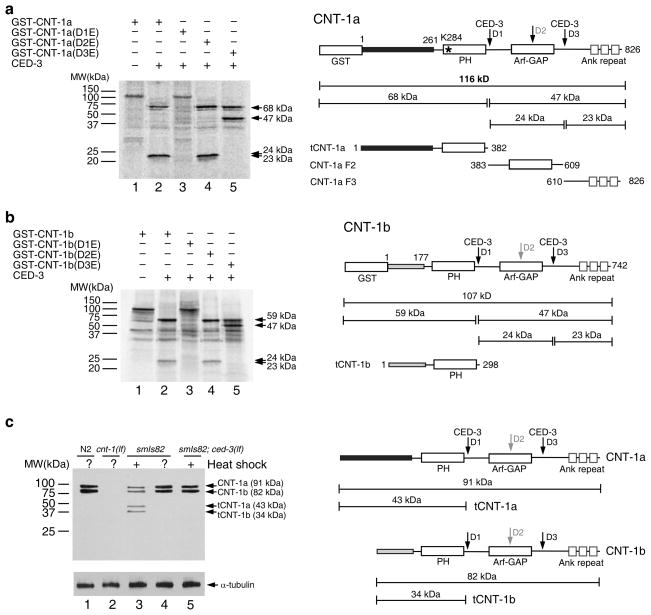
Figure 2.
Cleavage of CNT-1 by CED-3 in vitro and in vivo. (a) CED-3 cleavage assay of GST-CNT-1a. Left, 35S-Methionine labeled GST-CNT-1a and its mutant derivatives were incubated with or without CED-3 and resolved by 15% SDS polyacrylamide gel (PAGE). CED-3 cleavage products are indicated by arrows. Right, a schematic diagram of GST-CNT-1a with the sizes of the CED-3 cleavage products indicated (tCNT-1a, CNT-1a F2, and CNT-1a F3). Three predicted CED-3 cleavage sites are indicated with arrows. The black box at the N-terminus represents the region that is different from CNT-1b. The Lysine residue in the PH domain (K284) critical for lipid binding is indicated with an asterisk. (b) CNT-1b cleavage by CED-3. Left, GST-CNT-1b and its mutant derivatives were synthesized, labeled, digested with CED-3, and resolved on SDS-PAGE as described in a. Right, a schematic diagram of GST-CNT-1b with the sizes of the CED-3 cleavage products indicated. The gray box at the N-terminus represents the region that is different from CNT-1a. (c) Immunoblotting analysis of C. elegans embryos to show CED-3-mediated cleavage of CNT-1 in vivo. Left, embryos with the indicated genotype were treated with or without heat-shock, lysed and resolved on SDS-PAGE (see METHODS). Antibodies used were anti-CNT-1 antibody (upper panel) or an anti-alpha-tubulin antibody (lower panel)(Uncropped image in Supplementary Fig. 1e). Right, a schematic diagram of CNT-1a, tCNT-1a, CNT-1b, and tCNT-1b and their sizes.

