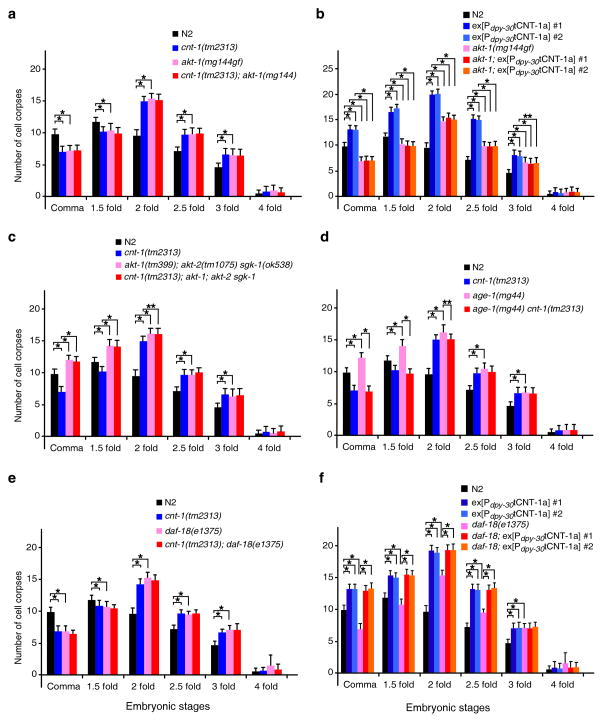
Figure 4.
cnt-1 acts downstream of age-1 but upstream of akt-1, akt-2, and sgk-1 to promote apoptosis. Cell corpses were scored in the indicated strains as in Fig. 3. The y axis represents average number of cell corpses and error bars represent s.d. Statistical significance values were determined by two-way ANOVA, followed by Bonferroni comparison (n = 15 embryos at each stage). * P < 0.001; ** P < 0.05.

