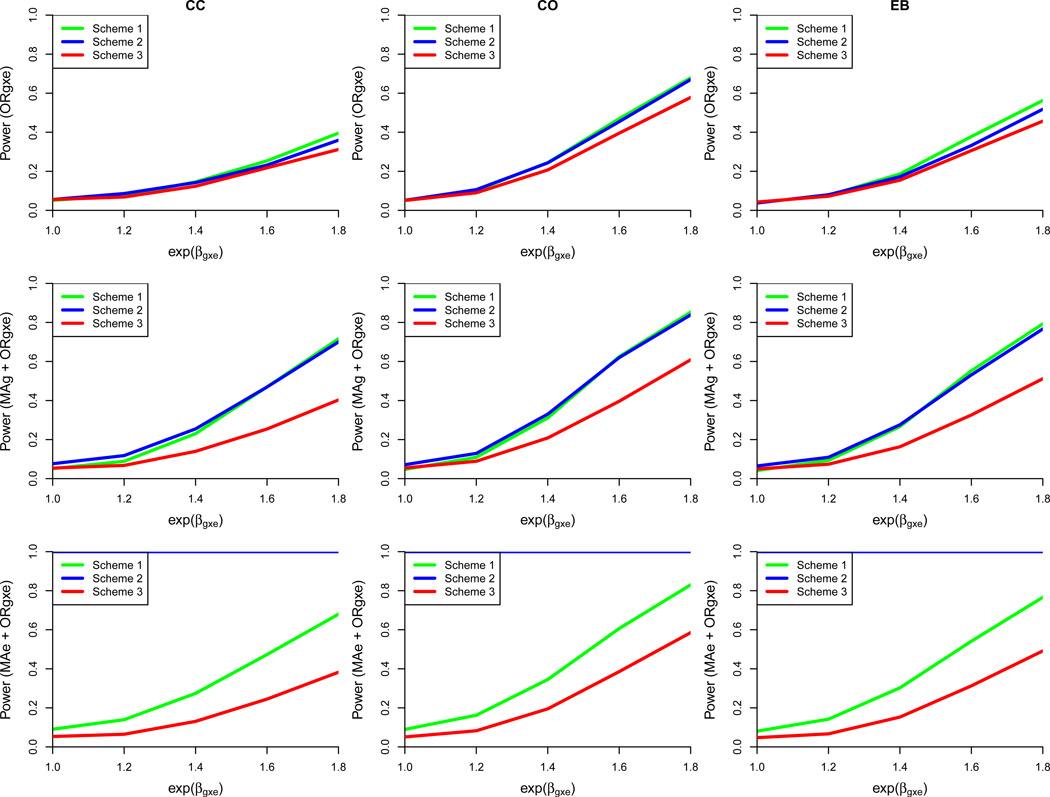
Figure 2.
Power comparison of three exposure-biased sampling designs under the base case with exposure misclassification (sensitivity = 0.8; specificity = 0.8). Each row represents one of three tests: G ×E interaction (ORg×e), joint marginal G and G×E interaction (MAg + ORg×e), or joint marginal E and G ×E interaction (MAe + ORg×e). Each column designates one of three different approaches for estimating the G ×E interaction parameter (CC = case-control, CO = case-only, EB = Empirical Bayes). Based on 5000 simulated datasets, 2500 cases and 2500 controls, genotype information on 1 marker, ORg = ORe = 1, an exposed control subsampling rate of 0.5 for Scheme 2, and gene-environment independence. Scheme 1: Genotype 50% of cases and 50% of controls including all E = 1 and a random sample of E = 0. Scheme 2: Genotype 50% of cases and 50% of controls including all exposed cases, 50% of exposed controls, and a random sample of E = 0. Scheme 3: Randomly sample 50% of cases and 50% of controls for genotyping, irrespective of exposure status.

