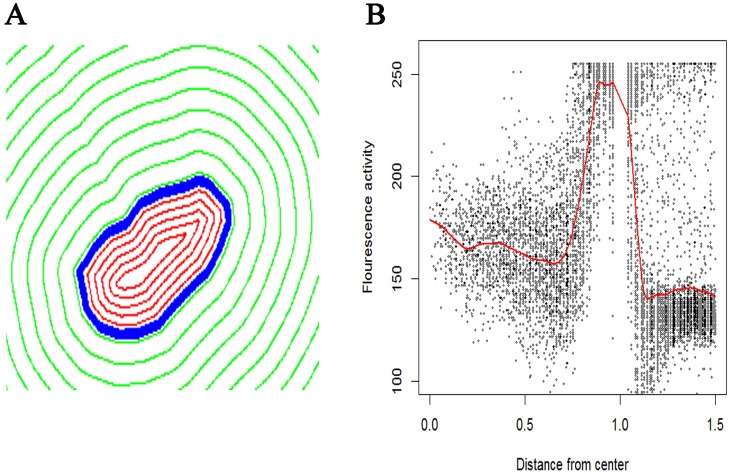
Figure 2. Radial distance map of a cell.
A) Blue line shows cell boundary (radial distance = 1). Red line show contours of equal radial distance within the cell (radial distance <1). Green lines show contours of equal radial distance outside the cell (radial distance >1). B) Plot of the distribution of PLCδ1-GFP expression as a function of distance from center of the cell. The red line shows the average activity as a function of distance, obtained via a smoothing line. The x-axis (radial distance) is truncated at 1.5 to avoid contamination of PLCδ1-GFP expression from other cells.

