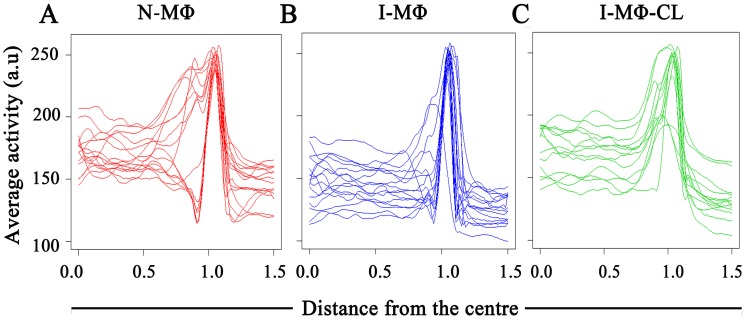
Figure 3. Analysis of PLCδ1 expression.
RAW264.7 cells were transfected with plcδ1-gfp plasmid. Average expressions (activity) of the PLCδ1-GFP were measured by computational analysis as a function of distance from center of cell. Each line represents a particular cell. Activity is on a scale of 0–255 (arbitary unit, a.u.). A) N-MΦ; B) I-MΦ; and C) I-MΦ-CL.

