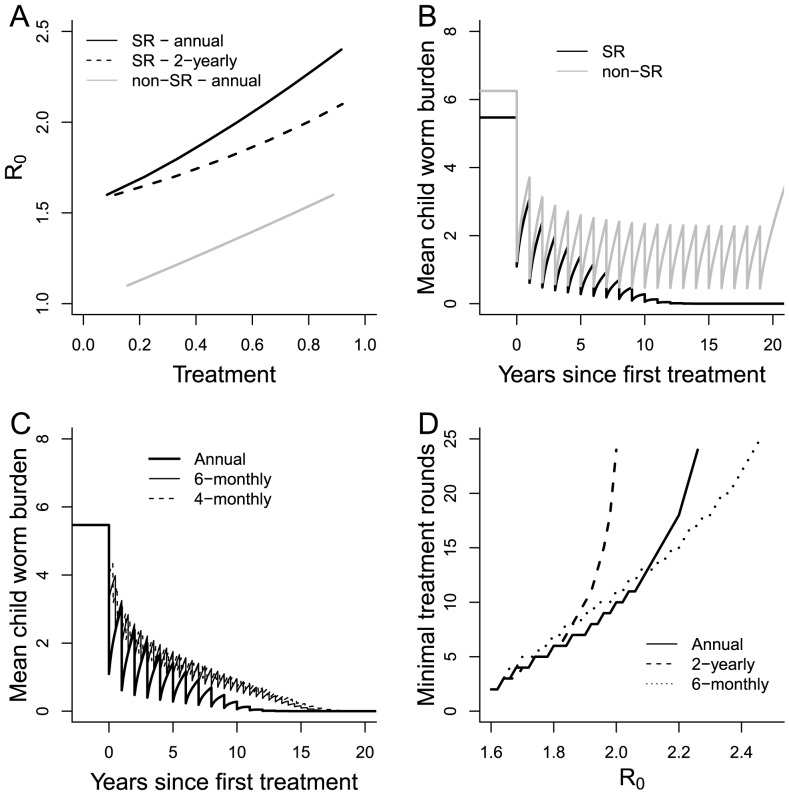
Figure 3. A) Critical treatment efficacy for SR and non-SR dynamics and different treatment intervals.
B) Evolution of worm burden in children under annual treatment with and without sexual reproduction dynamics (default parameter values and R0 = 2) C) Time series showing effect of different intervention frequencies with same annual treatment rate. D) Minimum number of treatment rounds necessary to achieve elimination (with SR) as a function of R0 and the interval between treatments.

