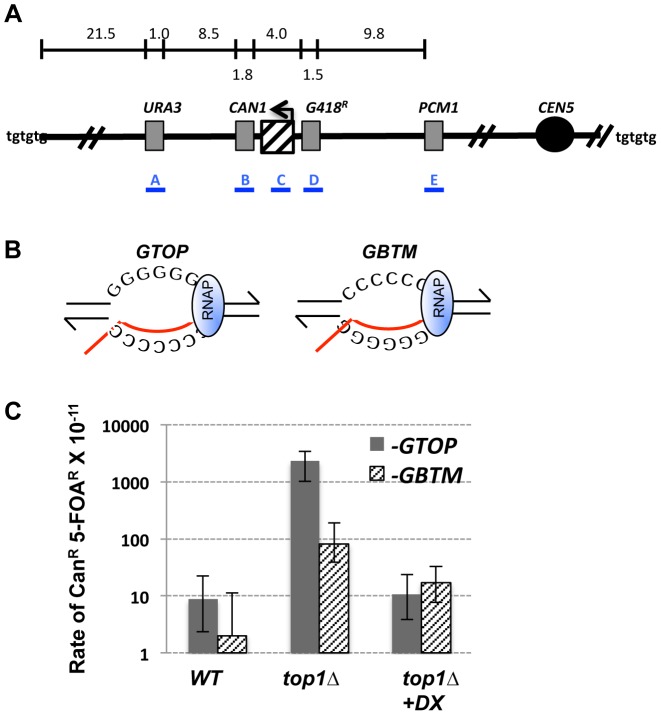
Figure 1. Gross Chromosomal Rearrangement (GCR) assay.
A. A schematic representation of the GCR assay. The location of pTET-lys2-GTOP or –GBTM cassette is indicated by the hashed box with the arrow above indicating the direction of transcription. The distances (in kb) are approximate and not to scale. Telomeres are represented as “tgtgtg”. Blue bars with labels A, B, C, D, and E represents the approximate location of the PCR products used for characterization of GCR products (see Table 1). B. The transcription orientations of the Sμ-containing cassettes. Guanine-runs are on the non-transcribed strand in single stranded state in pTET-lys2-GTOP cassette and on the transcribed strand annealed to the nascent RNA (red line) in the pTET-lys2–GBTM cassette. RNA polymerase holoenzyme is indicated by the blue oval. C. The rates of GCRs occurring at CHR5 containing the pTET-lys2-GTOP (gray bar) or –GBTM (hashed bar) cassette. +DX; Doxycycline was added to the final concentration of 2 µg/ml to repress the transcription from pTET. The relative RNA levels under high and low transcription conditions are shown in Table S1. *; the rates determined by the p0 method. **; the rates determined by the method of median. 95% confidence intervals are indicated by the error bars.

