
Figure 5. The rates of loss of heterozygosity at CHR3 in top1Δ backgrounds.
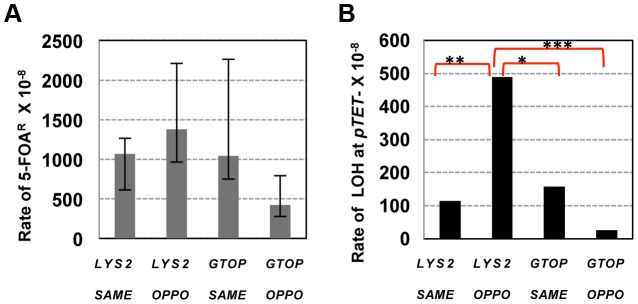
A. The total rates of LOH events (5-FOAR). GTOP, or GBTM indicates pTET-lys2-GTOP or pTET-lys2-BTM allele integrated in each of the strains analyzed. The 95% confidence intervals are indicated by the error bars. B. The rates of LOH initiating at pTET-lys2-GTOP or pTET-lys2-BTM cassette. LOH events are defined as initiating at pTET-lys2-GTOP or pTET-lys2-BTM cassette when URA3 and G418R are lost, only YJM789 sequence is present at StyI, BsrBI, and SpeI SNP sites and both YJM789 and YPH45 sequence is present at NarI and HindIII SNP sites (See Table S2, Table 2 and Table 4). P values were determined using the chi square analysis. *P = 0.014; **P = 0.0035; ***P<0.0001.