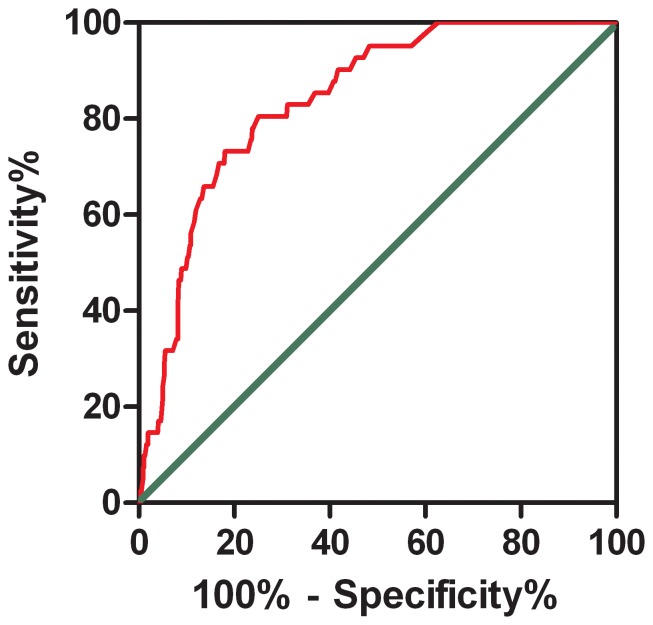
Figure 1. The receiver-operating characteristic (ROC) curve of the Logistic multivariate regression equation for predicting the likelihood of POTS.
The longitudinal axis represents sensitivity to predict the probability of POTS. The transversal axis represents the false positive rate (1-specificity) of the prediction. The 45° gray line of the graph stands for reference line, representing sensitivity being equal to false positive rate (e.g., does not have the predictive value completely). The red curve is farther from the reference line and nearer the upper left corner of the graph. Area under the curve was 0.839 (95% confidence interval: 0.786 to 0.891; p<0.001).

