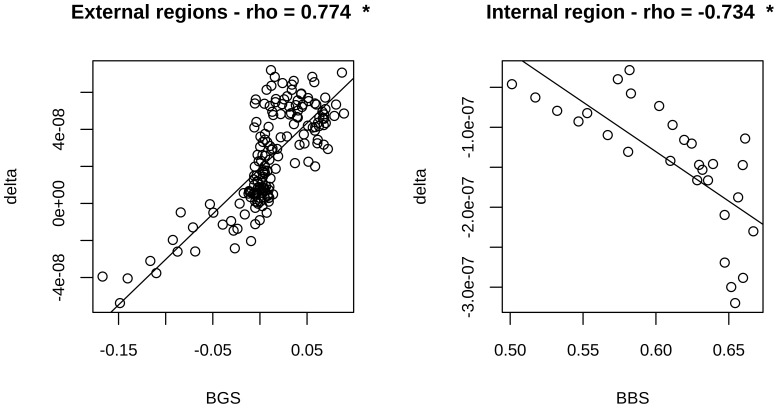
Figure 8. GERP and gBGC correlations for inner and outer regions.
Pearson correlations between BGS and BVF values in the outer region (left panel) and between BBS and BVF values in the inner region (right panel) are reported along with corresponding scatter plots for CGI-TSSs. * indicates statistically significant correlations.

