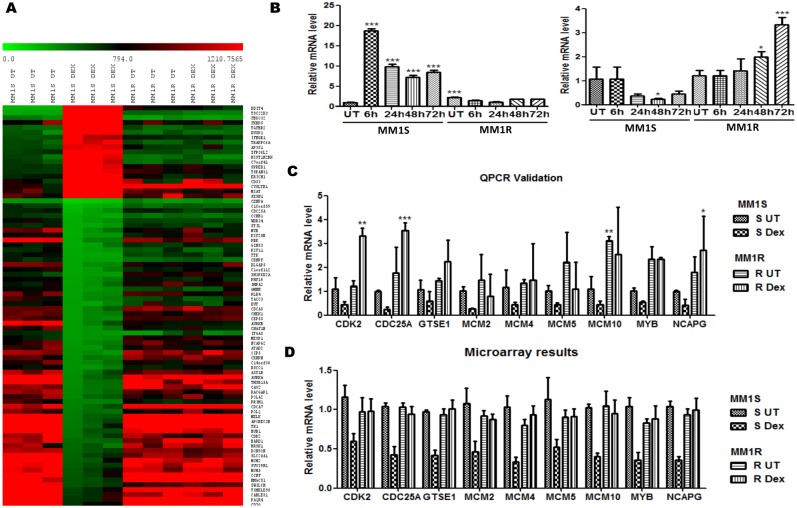
Figure 2. Dexamethasone triggers GC specific transcriptional changes in cell cycle, DNA damage/repair, cell death and immunological pathways in MM1S but not MM1R.
(A) The heat map represents relative gene expression levels of MM1S and MM1R cells, left untreated (solvent) or treated with 1 µM Dex for 72 h. Gene expression changes >2-fold and with a p-value <0.05 are plotted on the heat map. (B) Left panel: Realtime quantitative PCR (QPCR) validation of Dex dependent activation of GILZ (TSC22D3) mRNA transcription Right panel: Realtime quantitative PCR (QPCR) validation of Dex dependent repression of CDK2 mRNA in MM1S but not in MM1R. Means with ***, **, * are significantly different (p<0.001, <0.01 or <0.05 respectively) as compared to control setups, determined by one-way (Dunnett’s Post-test) (C–D) Realtime quantitative PCR (QPCR) validation and Illumina microarray observation of the top GC regulated genes involved cell cycle, DNA damage/repair and cell death in S = MM1S but not R = MM1R. All the QPCR validation studies have been normalized to the 28S RNA housekeeping gene and are represented relative to MM1S untreated condition (S UT). Bar graphs represent relative mRNA (mean ± SEM) levels of three independent experiments. Means with ***, **, * are significantly different (p<0.001, <0.01 or <0.05 respectively) from control setups as determined by two-way ANOVA (Bonferroni post-tests).

