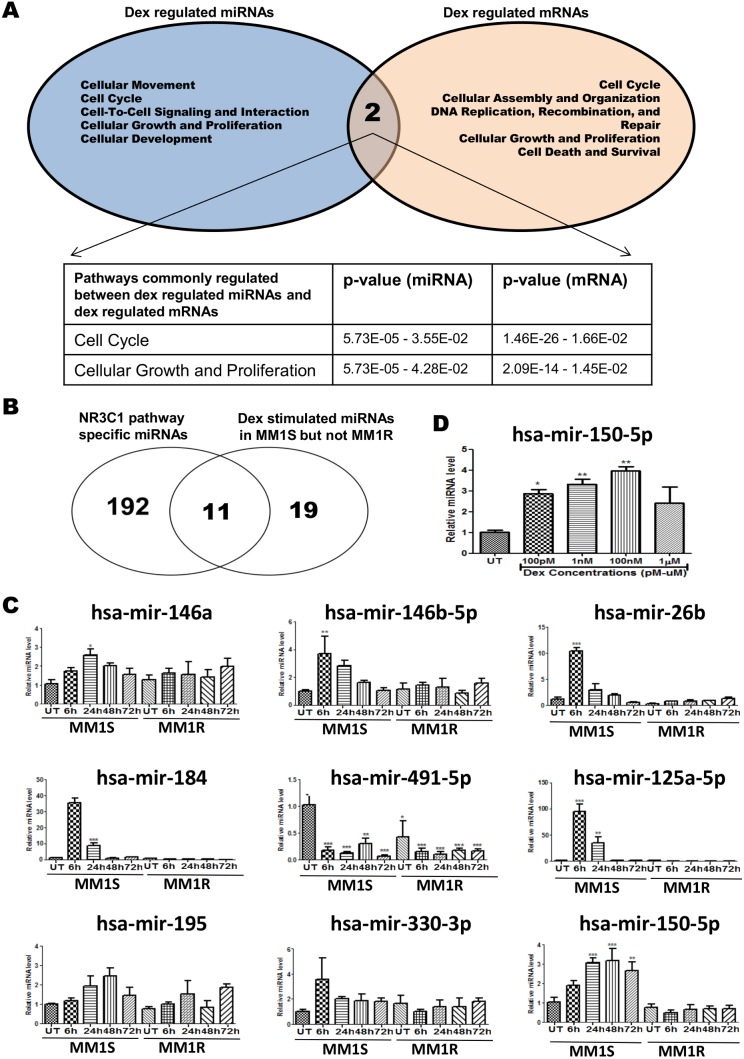
Figure 3. Experimental validation of GC inducible microRNAs, potentially involved in regulation of the NR3C1(GR) pathway in MM1S cells.
(A) Venn-diagram which summarizes the overlap between the top 5 predicted molecular and cellular functions generated by IPA from GC regulated miRNAs and GC regulated mRNAs (B) Venn-diagram which represents the crosscomparison of the list of GC responsive miRNAs identified in MM1S with the list of GR(NR3C1) pathway specific miRNAs according to MiRWalk prediction freeware. (C) Real-time QPCR validation of the transcription levels of 9 common miRNAs selected in Fig. 3B, in MM1S and MM1R cells treated for 24, 48 or 72 h with 1 µM Dex. (D) GC dose responsive regulation of mir-150-5p levels in MM1S cells treated for 72 h with GC. All the miRNA QPCR validation studies have been normalized to SNORD 95 and SNORD 96A housekeeping miRNAs according to manufacturer instructions and relative to MM1S untreated condition (S UT). Bar graphs represent relative miRNA (mean ± SEM) levels of three independent experiments as compared to control setups. Means with ***, **, * are significantly different to control setups (p<0.001, <0.01 or <0.05) as determined by one-way ANOVA (Dunnetts Post test).

