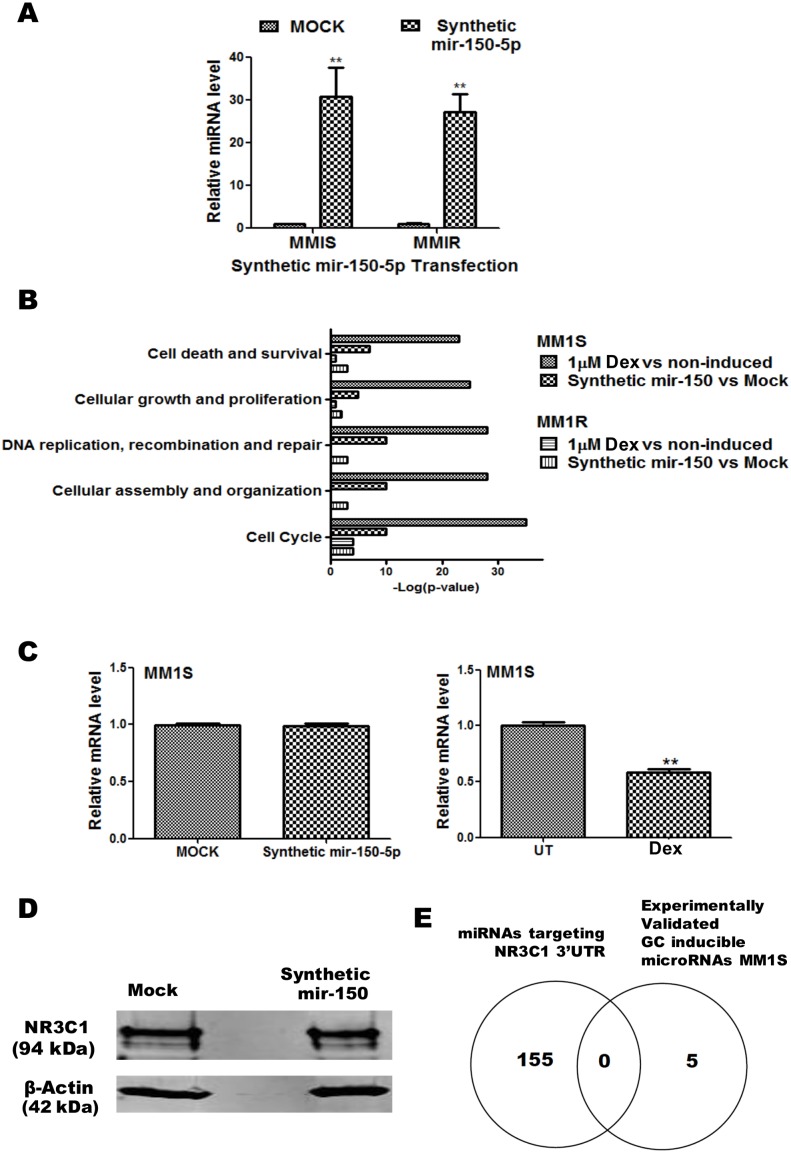
Figure 5. Mir-150-5p mimetic transfection triggers GR specific gene expression in MM1S but not in MM1R cells, without modulating GR protein levels.
(A) QPCR based quantification of synthetic mir-150-5p levels present 72 h after transfection of MM1S and MM1R cells. The miRNA expression levels have been normalized to SNORD 95 and SNORD 96A housekeeping miRNAs and are presented relative to MOCK control. Bar graphs represent relative miRNA (mean ± SEM) levels of three independent experiments. Means with ***, **, * are significantly different (p<0.001, <0.01 or <0.05) from control setups according to two-way ANOVA (Bonferroni post-tests). (B) Comparison of top enriched pathways (IPA) of mRNA changes in MM1S cells treated for 72 h to 1 µM Dex versus changes in MM1S and MM1R cells after 72 h mock transfection of transfection with synthetic mir-150-5p. (C) NR3C1/GRα protein levels detected following 72 h transfection of a synthetic mir-150-5p mimetic in MM1S cells. (D) Venn-diagram which represents the overlap of experimentally validated GC inducible microRNAs in MM1S cells with the list of miRNAs predicted to target the 3′UTR of NR3C1. (E) QPCR analysis of NR3C1/GRα mRNA levels present in MM1S cells following 72 h transfection of a synthetic mir-150-5p mimetic (left panel) or following 72 h Dex (1 µM) treatment (right panel).

