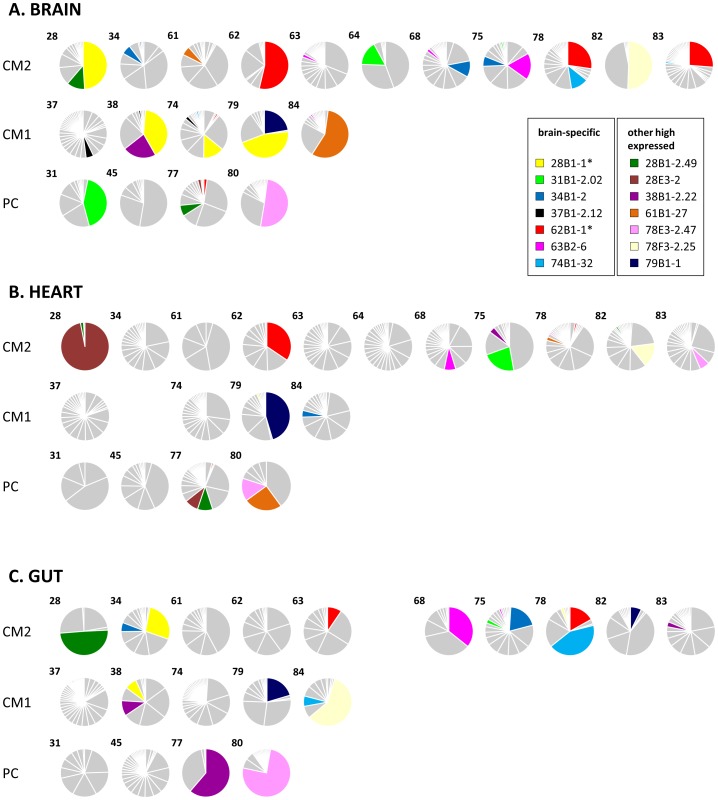
Figure 3. Distribution of individual var/PfEMP1-DBL1α types in the organs of fatal paediatric malaria hosts.
Each pie graph represents all DBL1α variants from a single organ of an individual host shown in the brain (A), heart (B) and gut (C). Case numbers are shown in the upper left corner of each graph and they are arranged by diagnostic group (CM, cerebral malaria; PC, parasitaemic controls). These charts are identical to those in Fig. 2 except that sections are shaded to highlight the DBL1α types that were detected in the highest number of different hosts. Further information on these can be found in S1 Table. The two DBL1α types detailed in results are marked with an asterisk.

