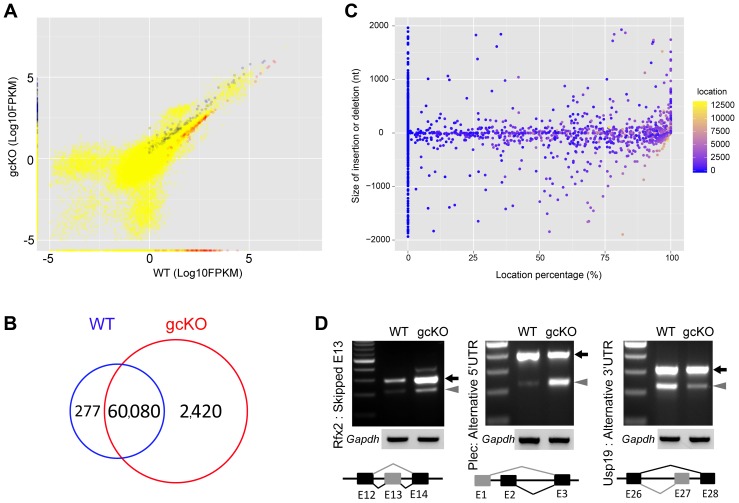
Figure 5. Disruptions of the mRNA transcriptome and alternative splicing patterns in Ranbp9 gcKO testes.
(A) Scatter plot showing significantly de-regulated transcripts in Ranbp9 gcKO testes compared to WT controls. Blue dots (2,313) represent significantly upregulated transcripts, while red dots (316) denote significantly downregulated transcripts (p<0.05, fold change>2). Yellow dots illustrate unchanged transcripts. (B) Venn diagram showing the number of unique transcript isoforms detected in Ranbp9 gcKO (2,420) and WT (277) testes. (C) Distribution of 1,816 aberrant splicing events (insertions or deletions) along the entire length of mRNAs in gcKO testes. The y-axis represents the size of insertions (positive values) or deletions (negative values), whereas the x-axis denotes location percentage (splicing location/total transcript size), reflecting the relative position of splicing events along the entire length of the transcripts, e.g., 0% refers to the very 3′end, 50% means the middle of the transcript and 100% indicates the very 5′end. (D) Semi-qPCR-based detection of aberrant alterative splicing patterns in three RANBP9 direct target mRNAs (Rfx2, Plec and Usp19). Lower panels represent the schematic diagram of alternatively spliced exons detected by RNA-Seq analysis. Gapdh was used as a loading control.

