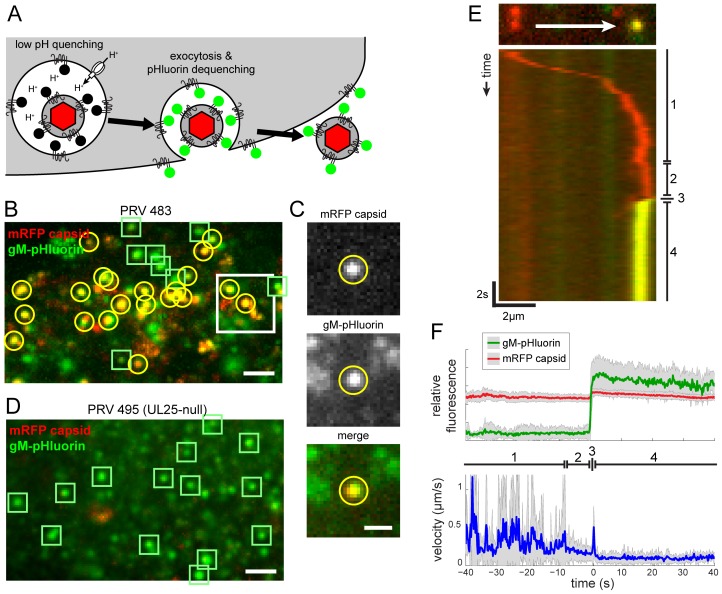
Figure 2. Live-cell fluorescence microscopy of particle transport and egress.
(A) Schematic of virus particle transport and exocytosis assay. gM-pHluorin incorporated into virus particles or secretory vesicles is quenched in the acidic lumen of secretory vesicles (black circles), but the mRFP capsid tag is not (red hexagon). Upon exocytosis, pHluorin is exposed to neutral extracellular medium, and becomes fluorescent (green circles). (B) Virus particle exocytosis. PRV 483 infected cells were imaged at 4.5–5 hpi. Image is a maximum difference projection corresponding to Movie S1, depicting viral exocytosis events over a 13 min time course. Exocytosis of gM-pHluorin particles that do not contain capsids (green squares) and particles containing both gM-pHluorin and mRFP capsids (yellow circles) are indicated. Scale bar represents 2 µm. (C) Still images from Movie S1, depicting a single viral exocytosis event. Images correspond to the boxed area in panel B. Scale bar represents 1 µm. (D) Transcytosis of virus inoculum is almost never observed. Cells were infected with PRV 495 and imaged as in panel B. Image is a maximum difference projection corresponding to Movie S2, depicting exocytosis events over a 13 min time course. Exocytosis of gM-pHluorin particles that do not contain capsids are indicated by green squares. Particles containing mRFP capsids are almost never observed (not shown). Scale bar represents 2 µm. (E) Kymograph of a virus particle exocytosis event from Movie S1, depicting mRFP capsid (red) and gM-pHluorin (green) fluorescence over time. (F) Ensemble average of relative gM-pHluorin fluorescence (top, green line), mRFP capsid (top, red line), and instantaneous velocity (bottom, blue line) over 32 exocytosis events, in 10 cells, in 4 independent experiments. Shaded area represents standard deviation. (D and E) Virus particles exhibit stereotyped pattern of movement. (1) Fast directed transport. (2) Terminal pause. (3) Sharp jerk. (4) Mostly immobile.

