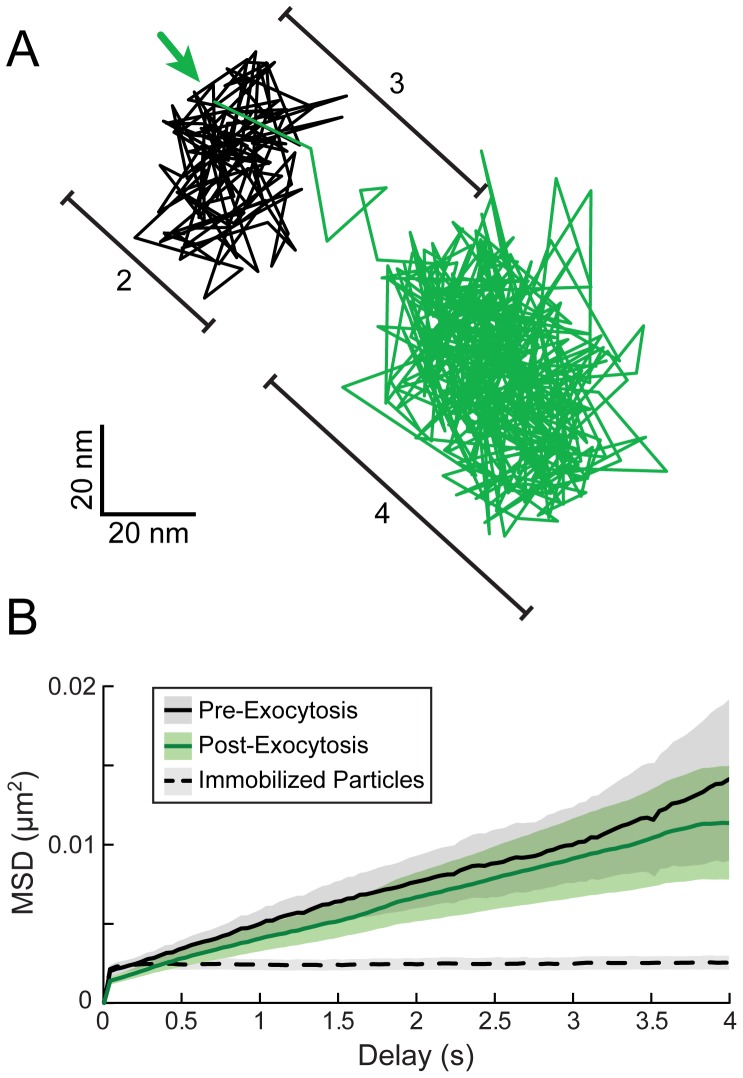
Figure 3. High time-resolution tracking and MSD analysis of particle movement.
(A) PRV 483 infected cells were imaged at a rate of 25–50 frames/second, and particles were tracked before and after exocytosis. Graph shows one representative particle track, color-coded to indicate relative gM-pHluorin fluorescence. The location of gM-pHluorin dequenching is indicated (arrow). Bracketed regions correspond to pattern of movement indicated in Figure 2E and F: (2) Terminal pause. (3) Sharp jerk. (4) Mostly immobile. (B) Average MSD curves of particle tracks before and after exocytosis. Based on slope and MSD values, particles are confined an area approximately 400 nm in diameter before and after exocytosis (n = 43 exocytosis events, in 9 cells, in 3 independent experiments). Dotted MSD curve represents particles immobilized on glass (n = 249 particles). Shaded areas represent standard error of the mean.

