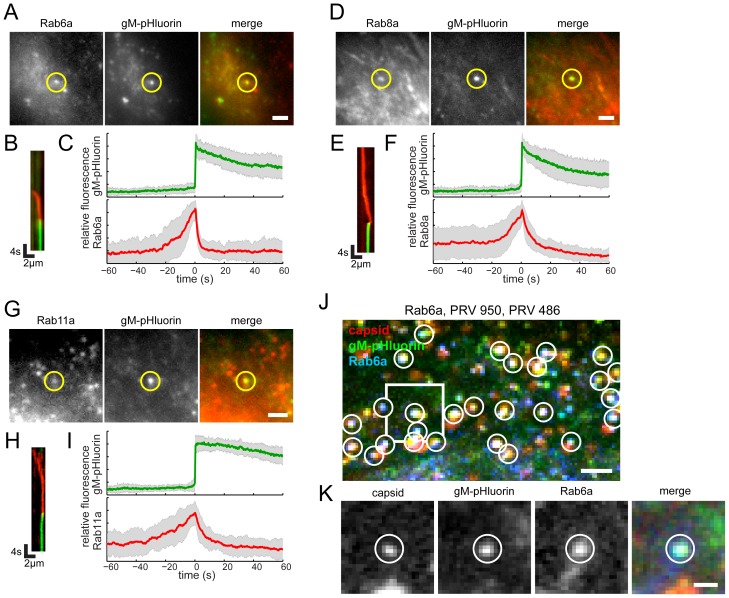
Figure 4. Rabs associated with virus particle exocytosis.
Cells were transduced to express mCherry-tagged Rab proteins, infected with PRV 486 expressing gM-pHluorin, and imaged at 4.5–5 hr after PRV infection. (A,D,G) The indicated Rab proteins colocalize with gM-pHluorin particle at the moment of exocytosis (yellow circle). Images correspond to Movie S3. Scale bars represent 2 µm. (B,E,H) Kymographs of indicated Rab protein (red) and gM-pHluorin (green) fluorescence over time. (C,F,I) Ensemble averages of gM-pHluorin (top, green line) and indicated Rab protein (bottom, red line) relative fluorescence. Shaded area represents standard deviation. (A–C) mCherry-Rab6a. Data represent 37 exocytosis events in 4 independent experiments. (D–F) mCherry-Rab8a. Data represent 41 exocytosis events in 3 independent experiments. (G–I) mCherry-Rab11a. Data represent 34 exocytosis events in 3 independent experiments. (J–K) Rab6a is associated with exocytosis of assembled virions containing capsids. Cells were transduced to express mCherry-Rab6a, and co-infected with PRV 950 and PRV 486. (J) Image is a maximum difference projection corresponding to Movie S4, depicting virus particle exocytosis events over a 13.7 min time course. Exocytosis events associated with Rab6a (blue) containing gM-pHluorin (green) and capsids (red) are indicated (white circles). Scale bar represents 2 µm. (K) Still images from Movie S4, depicting a single viral exocytosis event. Images correspond to the boxed area in panel B. Scale bar represents 1 µm.

