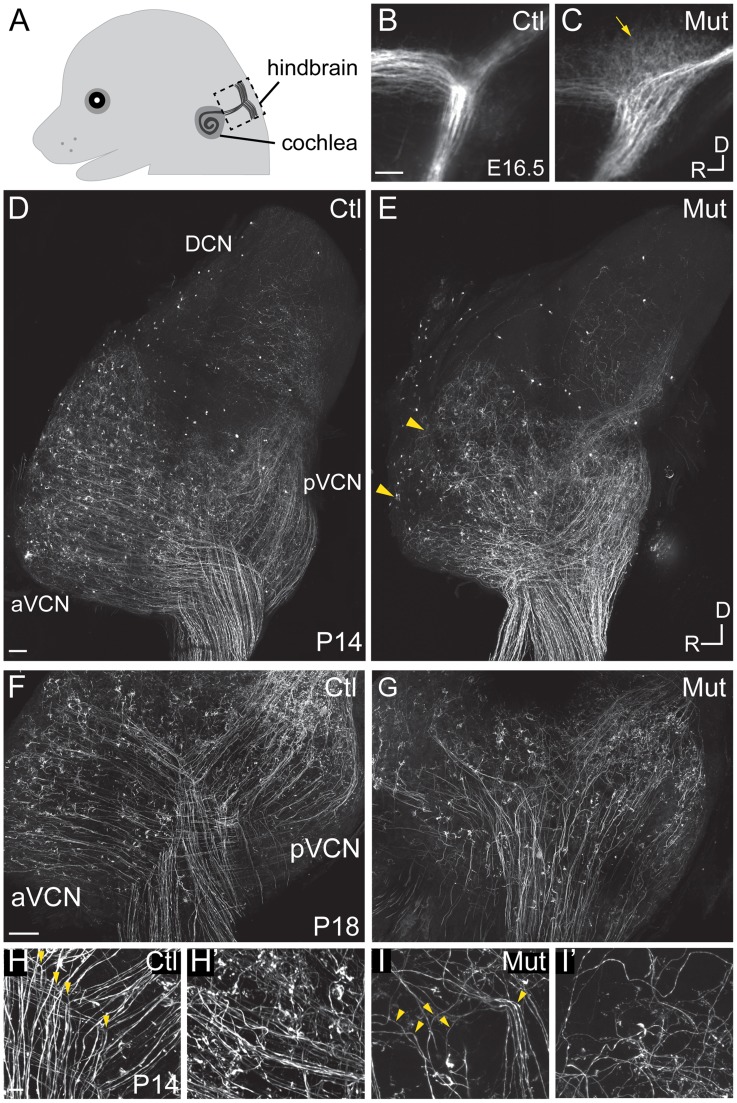
Figure 2. Npr2 mutant mice show SGN central axon guidance and bifurcation defects.
(A) Schematic diagram of E16.5 embryo head showing SGN axons projecting from the cochlea into the hindbrain. The boxed area indicates the hindbrain region shown in B and C. (B,C) Dye labeling of SGN central axons in the hindbrain at E16.5. (B) SGN axons normally exhibited a stereotyped bifurcation pattern in the developing brainstem at E16.5, as shown in a control heterozygous embryo (Ctl). (C) In Npr2 mutants, axons appeared disorganized in the region where they would normally bifurcate (arrow), and the nerve root lacked the distinctive Y-shape. Dorsal (D) is up and rostral (R) is to the left. (D–I) Genetic labeling of SGN central axons at postnatal stages (P14–18) using Ngn1-creERT2 and AI14-tdTomato, which allows random, relatively sparse labeling of SGNs. (D–E) Tiled confocal stack projections showing the entire cochlear nucleus of control (Ctl) (D) and Npr2 mutant (Mut) (E) animals at P14, an approach that permits the overall pattern of SGN axon organization to be qualitatively assessed. Control SGN axons projected in a highly organized fashion to the aVCN, pVCN, and DCN (D). In an Npr2 mutant, SGN axons still projected to aVCN, pVCN, and DCN, but in a disorganized pattern (E). Yellow arrowheads indicate regions in the aVCN that appear under-innervated. (F–G) Confocal stack projections of vibratome-sectioned control and Npr2 mutant cochlear nuclei at P18. Visual inspection of SGN axons confirmed the presence of stereotypical Y-shaped branch points and orderly projections to aVCN and pVCN in controls (F). In contrast, SGN projections to aVCN and pVCN were disarrayed in Npr2 mutants (G). (H–H′) Control SGN axons exhibited characteristic bifurcations (yellow arrowheads, H) and formed organized bundles of axonal branches in aVCN (H′) at P14. (I–I′) Npr2 mutant SGN axons generally turned instead of bifurcating (yellow arrowheads, I) and followed aberrant trajectories in aVCN (I′). Scale bar in A, 50 µm. Scale bars in D and F, 100 µm. Scale bar in H, 10 µm.

