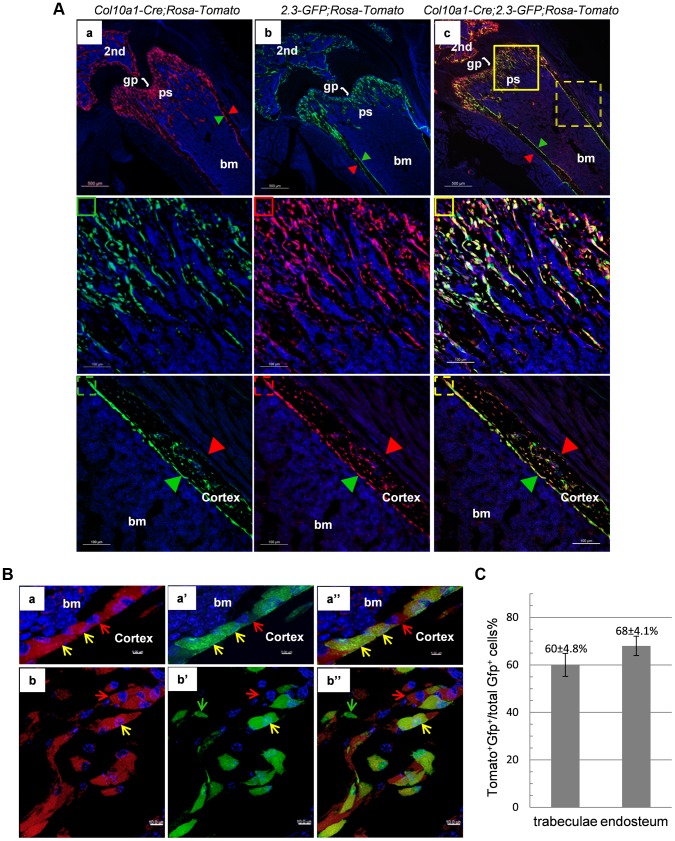
Figure 5. Cellular colocalization of the chondrocyte-derived tomato marker and a 2.3Col1-GFP osteoblast specific marker in femur sections of Col10a1-Cre;2.3Col1-GFP;ROSA-tdTomato triple transgenic mice.
A: The femur fluorescence images of 3-week-old Col10a1-Cre;2.3Col1-GFP;ROSA-tdTomato mouse and Col10a1-Cre; ROSA-tdTomato and 2.3Col1-GFP;ROSA-tdTomato control mice. Panel a: only Tomato+ cells (red) no EGFP+ (green) cells were present in Col10a1-Cre; ROSA-tdTomato control mice. Panel b: only EGFP+ cells no Tomato+ cells were present in 2.3Col1-GFP; ROSA-tdTomato control mice. Panel c: Tomato+, EGFP+ and Tomato+EGFP+ cells were distributed in the trabecular region, on the endosteum and in the secondary ossification center. The solid square in panel c indicates the enlarged trabeculae region; The dashed square in panel c indicates the enlarged cortical region; The green squares: blue and green channels; The red squares: blue and red channels; The yellow squares: blue, green and red channels; Red arrowhead: periosteum; Green arrowhead: endosteum. 2nd: secondary ossification center. B: Magnified images of cells in A-c. Panels a, a′ and a″: magnified cortical region. a: blue and red channels; a′: blue and green channels; a″: blue, red and green channels. Panels b, b′ and b″: magnified trabecular region. b: blue and red channels; b′: blue and green channels; b″: blue, red and green channels. Red arrows indicate Tomato+EGFP− cells. Green arrows indicate Tomato−GFP+ cells. Yellow arrows indicate Tomato+EGFP+ cells. Bm: bone marrow. C: The percent quantitation of EGFP+ cells which were derived from Col10a1-expressing mature chondrocytes in trabecular and cortical regions respectively.

