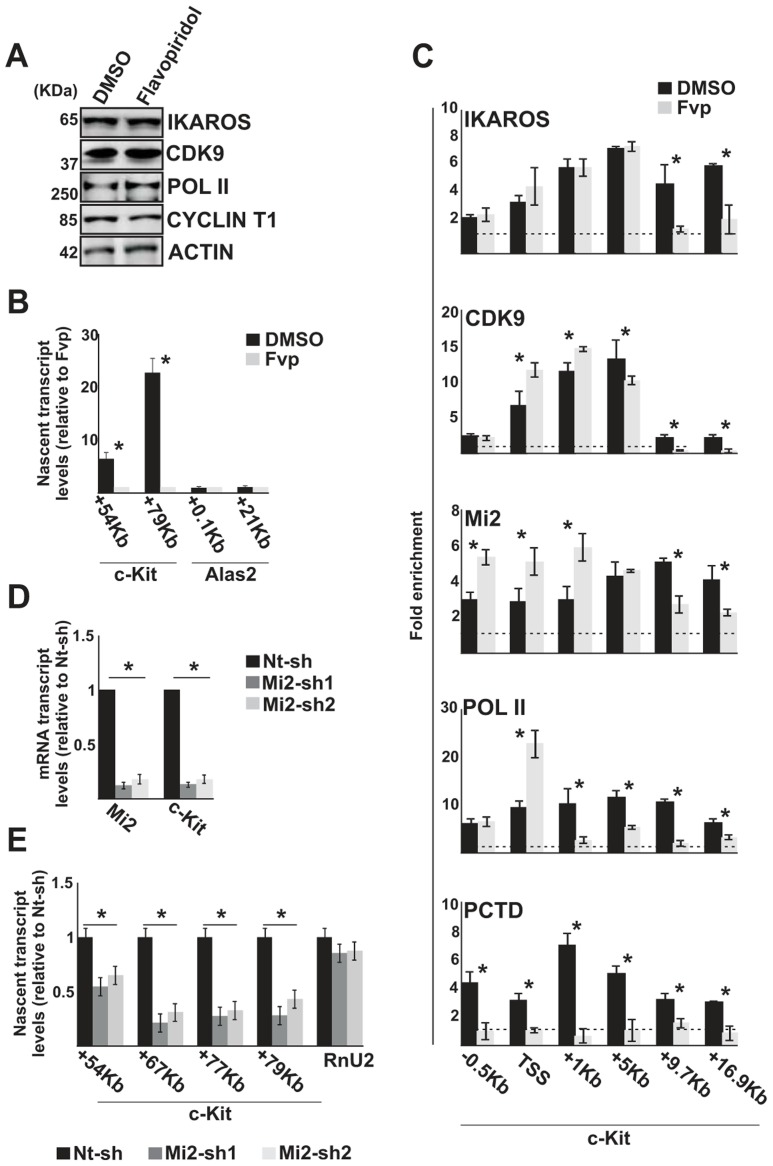
Figure 3. The IKAROS-NuRD-P-TEFb complex assists POL II during transcription elongation.
In panels A–C, G1E2 cells were treated for 2 h either with 0.01% DMSO (DMSO) or 100 nM Flavopiridol (Fvp). A) Protein expression analysis. Western blot assays of total cell lysates of DMSO- or Flavopiridol-treated G1E2 cells; ACTIN was used as an internal control; the antibodies used are indicated on the right side of the panels; B, E) Gene expression profiles. RNA samples were retro-transcribed with random oligonucleotides to amplify nascent transcripts, which were used as templates for qPCR with intron-specific c-Kit (+54 Kb, +67 Kb, +77 Kb, +79 Kb regions) or Alas2 (+0.1 Kb, +21 Kb regions) primer sets; Rnu2-1 (a Flavopiridol-insensitive gene) was used as internal control in panel B; Gapdh was used as internal control in panel E; y axis: relative nascent transcript enrichment levels; ratios are plotted as the mean ± Standard Deviation (SD) of the measurements; n≥4; C) ChIP assays were carried out with the antibodies indicated on the top of each panel; POL II: is an antibody against the N-terminal region of the large subunit of POL II and binds POL II in a phosphorylation-independent manner; PCTD: is an antibody against the CTD repeats phosphorylated at Ser2; y-axis: fold enrichments of c-Kit regions (−.5 Kb; TSS, +0.5 Kb, +1 Kb, +5 Kb, +9.7 Kb, +16.9 Kb ORF regions) relative to Thp promoter and input samples are plotted as the mean ± SD of the measurements; a value of 1 (dotted lines) indicates no enrichment; n≥4; D) Gene expression profiles. mRNA samples were retro-transcribed with oligo-dT nucleotides; cDNA was used as template for qPCR with gene-specific primer sets; β-Actin was used as internal control; y axis: relative mRNA enrichment levels; ratios are plotted as the mean ± SD of the measurements; n≥4. *: P≤0.05 by Student's t-test.

