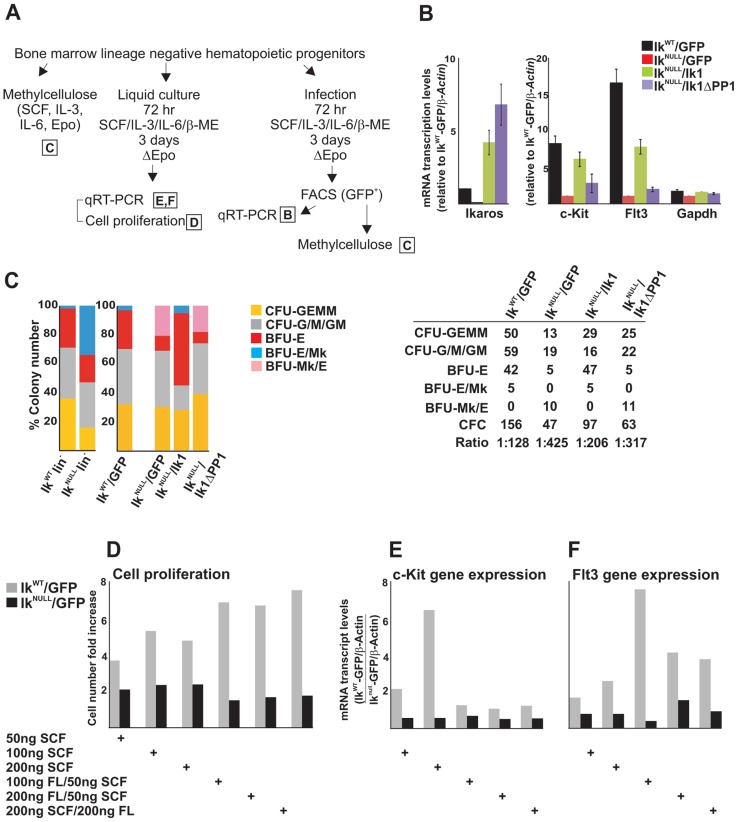
Figure 5. The IKAROS-PP1 interaction is required for normal hematopoietic differentiation.
Ikaros homozygote null (IkNULL) bone marrow-derived lineage negative (lin−) hematopoietic progenitor cells (HPCs) were transduced with pMSCV/Ik (IkNULL/Ik), pMSCV/IkΔPP1 (IkNULL/IkΔPP1) or the empty pMSCV vector (IkNULL/GFP); Ikaros wild type (IkWT) lin− HPCs were transduced with the empty pMSCV vector only (IkWT/GFP); A) Scheme of the experimental procedure; Epo: Erythropoietin; ΔEpo: absence of Erythropoietin; B) Gene expression profiles in lin− transduced HPCs; mRNA samples were retro-transcribed with oligo-dT nucleotides; cDNA was used as templates for qPCR with Ikaros, c-Kit, Flt3 or Gapdh specific primer sets; β-Actin was used as internal control; y axis: relative mRNA enrichment levels; ratios are plotted as the mean ± SD of the measurements; n = 3. *: P≤0.05 by Student's t-test; C) In vitro hematopoietic differentiation of lin− HPCs. Clonogenic assays in methylcellulose of uninfected (IkWT lin− and IkNULL lin−) or transduced (IkWT/GFP; IkNULL/GFP; IkNULL/Ik; IkNULL/IkΔPP1) lin− HPCs; cells were seeded on methylcellulose and colonies were scored at day 14; CFU-GEMM: colony forming unit granulocyte, erythrocyte, macrophage, megakaryocyte; CFU-G/M/GM: collectively identifies granulo-macrophage colonies, BFU-E: burst-forming unit erythrocyte; BFU-E/Mk: immature erythroid colonies with elevated megakaryocytic content; BFU-Mk/E: almost pure megakaryocyte colonies that contain only few clusters of immature erythroid cells; the data shown are representative of three independent experiments; table: absolute number of methylcellulose colonies; CFC: Colony Forming Cell; Ratio: ratio of methylcellulose colonies per number of plated lin− HPCs; D–F) Cell proliferation and gene expression profiles in IkWT/GFP and IkNULL/GFP transduced lin− HPCs upon SCF (Stem Cell Factor) and FL (Flt3 ligand) treatment; IkWT/GFP and IkNULL/GFP transduced lin− HPCs were treated for 3 days with SCF and/or FL at the concentrations indicated at the bottom of the panels; D: cell proliferation and cell viability was determined by Trypan blue staining; y axis: cell number fold increase at day 0 and day 3; E, F: gene expression profile studies were carried out as detailed in panel B using β-Actin as internal control; y axis: mRNA enrichment levels relative to IkNULL-GFP/β-Actin values; the data shown in panels D–F are representative results of three independent experiments.

