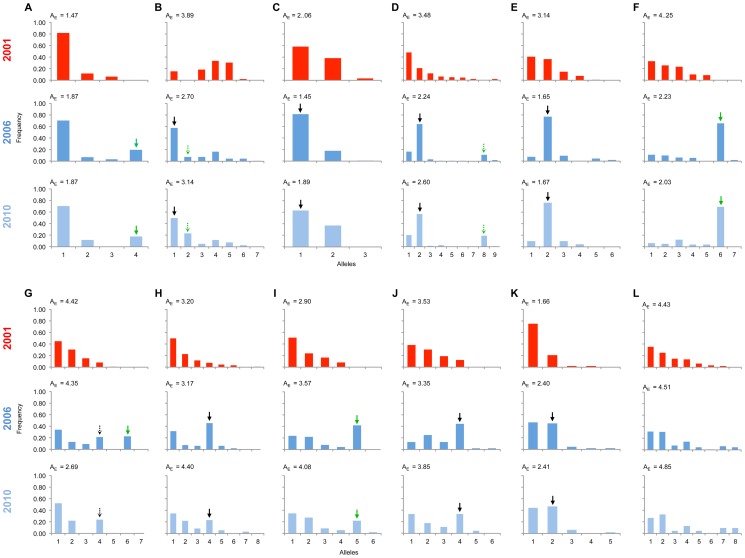
Figure 3. Allele frequency distributions across the linkage group carrying the suppressor in 2001, 2006 & 2010.
The major allele variant for each locus (A-L) that has increased in frequency during the sweep is indicated with a solid arrow, while the secondary allele that increases (in 3 cases) is indicated with a dotted arrow. Where the allele is novel in 2006/2010 the arrow is green. Results of statistical comparison presented in S1 Figure. Effective allele numbers (AE) are indicated on each graph.

