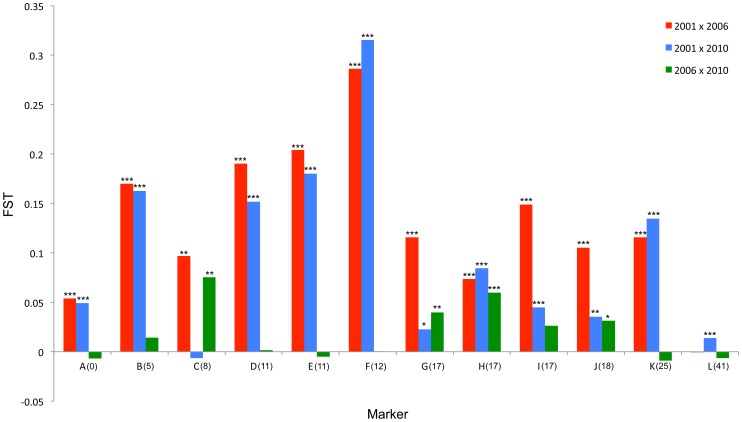
Figure 4. FST standardized population genetic differentiation between samples from different time points for each locus along the chromosome carrying the suppressor.
Blue: 2001–2006; Red: 2001–2010; Green: 2006–2010. Statistically significant deviations from FST = 0 given by *** (p<0.001), ** (p<0.01) * (p<0.05) uncorrected for multiple tests. Depiction of suppressor linkage group given for reference. Position along SLG given in parenthesis on X-axis.

