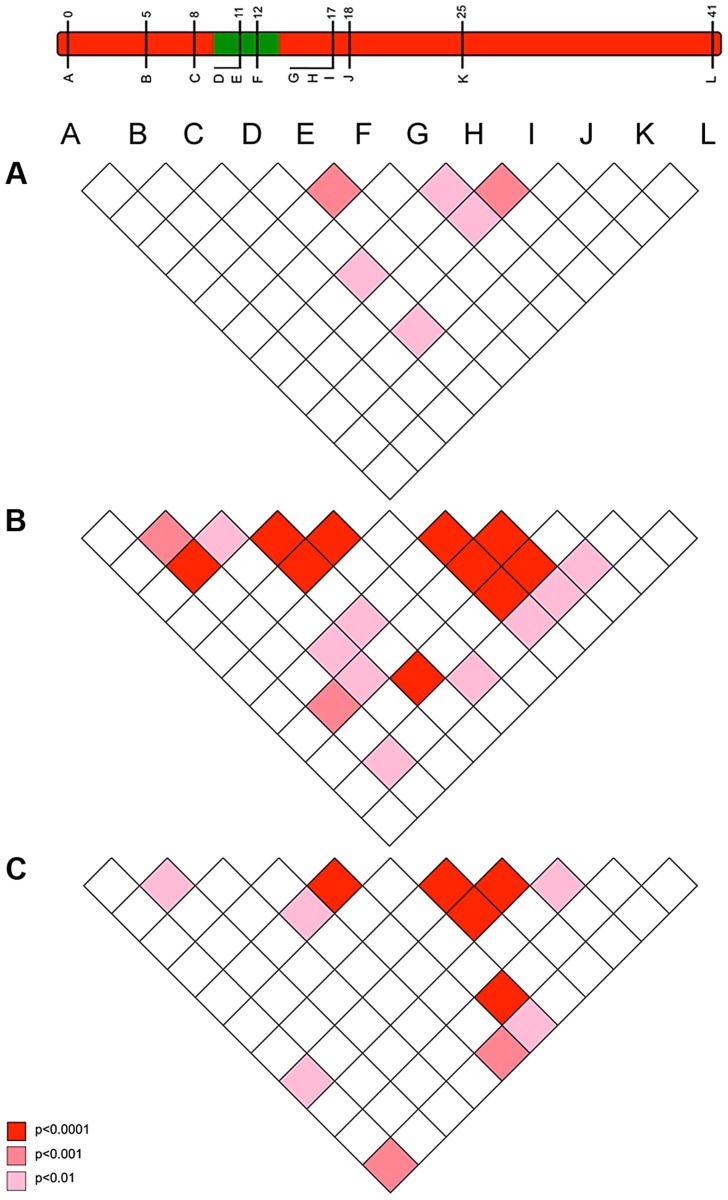
Figure 5. The pattern of linkage disequilibrium (association) between loci observed in 2001 (pre-sweep), 2006 (immediately post-sweep) & 2010 (4 years post sweep) population samples.
Pattern of linkage disequilibrium (LD) between suppressor-linked loci (A-L) for a) 2001 (pre-sweep), b) 2006 (immediately post-sweep), and c) 2010 (4 years post-sweep). Significance denoted by colour: deep red – significant LD as measured at p<0.001; mid red – significant LD as measured at p<0.01; pink – significant LD as measured at p<0.05, all uncorrected for multiple tests. Depiction of suppressor linkage group given for reference.

