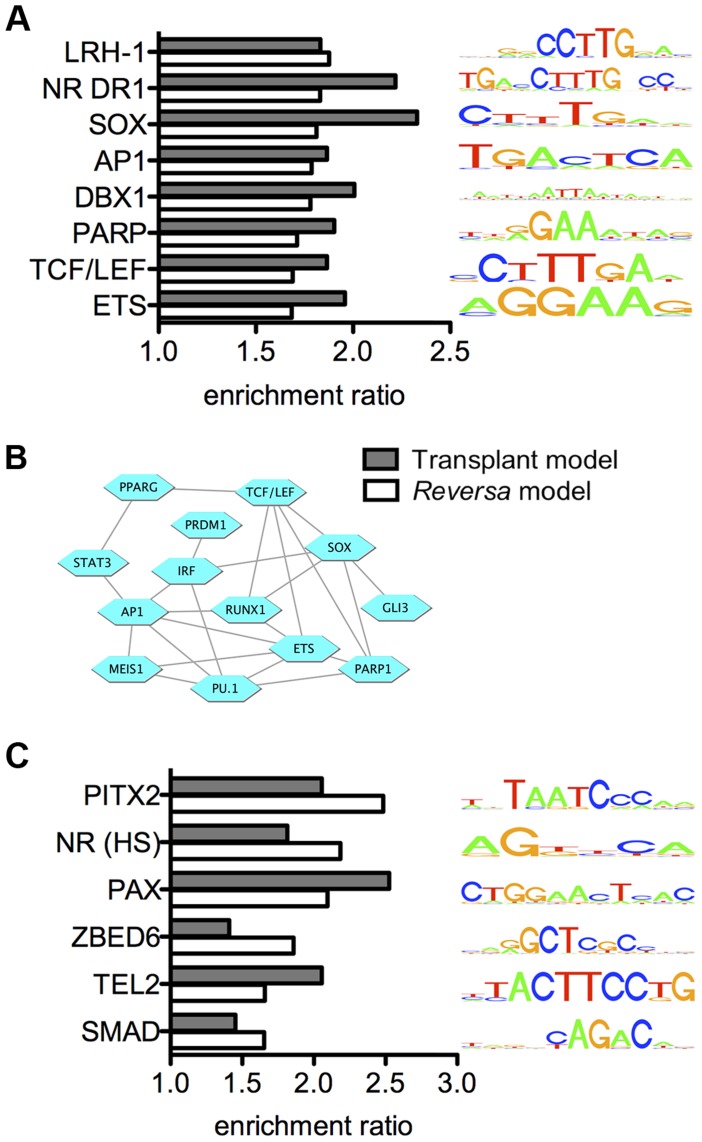
Figure 3. Integrated analysis reveals candidate regulators of the macrophage transcriptional response to lipid lowering in vivo.
(A) Transcription factor binding site motifs whose matches are statistically overrepresented within 5′ regulatory regions of genes that are upregulated in plaque macrophages in response to lipid lowering in vivo. Bars indicate the ratio of the number matches of the indicated motifs per kbp, within an upregulated gene set, to the number of motif matches per kbp for randomly selected sets of genes expressed in CD68+ cells. Bar color indicates the regression model: white, Reversa model; gray, aortic transplant model. Only motifs for which the ratio exceeds 1.5 (with a statistical significance of P<0.01) in both models are shown (complete list in Table S9). Motifs are labeled by the transcription factor family name with which they are associated (motif IDs are provided in Table S9). Each motif is represented by a four-color motif logo. (B) The transcription factors that are associated with upregulated genes are highly interconnected at the level of protein-protein interaction network. Blue hexagons represent transcription factors or transcription factor families, and edges denote protein-protein interactions between them. (C) Transcription factor binding site motifs whose matches are statistically overrepresented within 5′ regions of genes that are downregulated in plaque macrophages in response to lipid lowering in vivo. “NR (HS)”, nuclear receptor half-site.

