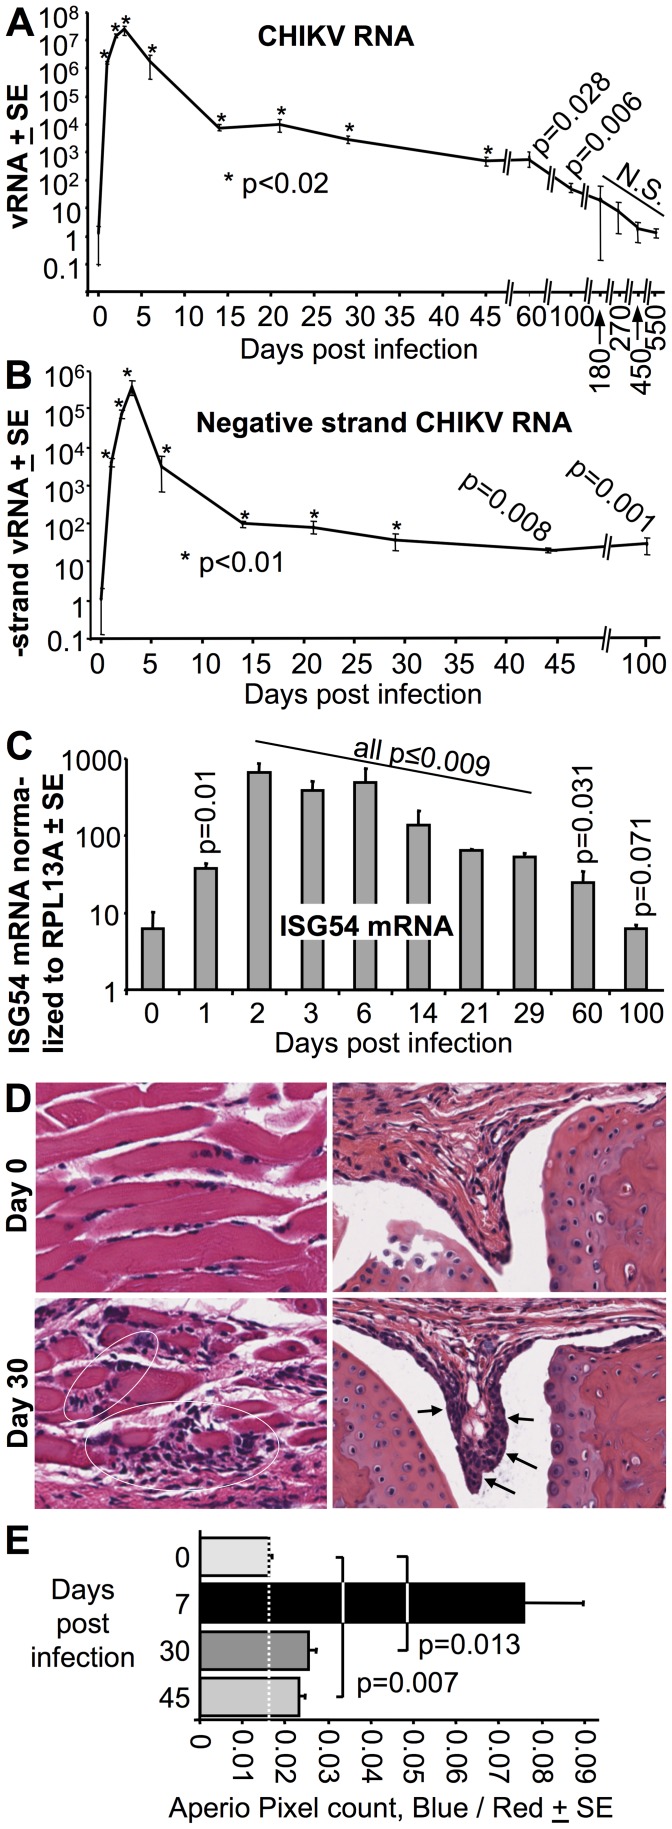
Figure 5. Persistent CHIKV RNA, up-regulation of ISG54 and inflammatory infiltrates in C57BL/6 mice.
(A–C) RNA was isolated from feet of infected mice at the indicated time points and analyzed by qRT-PCR. (A) CHIKV RNA levels determined by standard qRT PCR using primers specific for E1 normalized to RPL13A mRNA levels (n = 3–7 feet from independent mice per time point). Statistics by Mann-Whitney U tests comparing RNA levels at the indicated times post infection with levels at time 0. (B) Negative strand-specific qRT PCR using primers specific for nsP1 (n and statistics as for A). (C) ISG54 RNA levels as determined by standard qRT PCR, normalized to RPL13A mRNA levels (n and statistics as for A). (D) H & E staining of feet day 0 and day 30 post CHIKV infection. Infiltrates are shown for day 30 in muscle tissue (bottom left, while circles) and in the synovial membrane (bottom right, black arrows). (E) Aperio Positive Pixel Count determination of the ratio of blue (nuclear) to red (cytoplasmic) staining areas in whole foot sections at the indicated times post-infection. Leukocytes tend to have a high nuclear/cytoplasmic area ratio, so elevated ratios in whole foot sections indicate the presence of leukocyte infiltrates. (n = 3/4 feet from independent mice per time point, statistics by t test).

