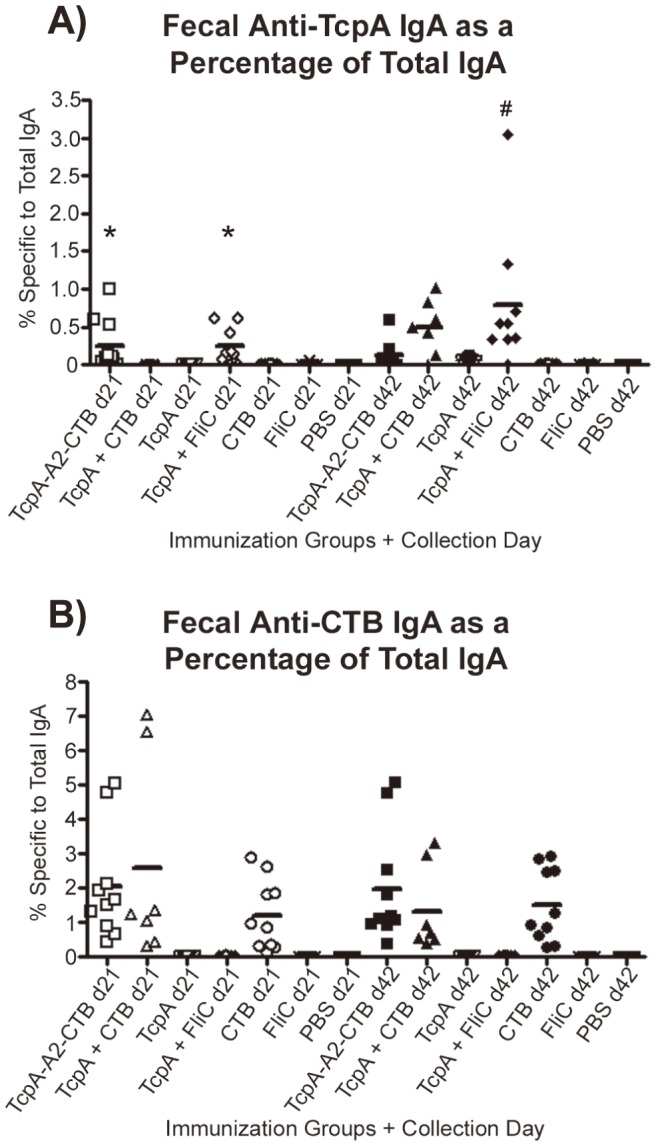
Figure 6. Measurements of anti-TcpA and anti-CTB IgA antibodies in fecal extracts from adult mice after immunization with TcpA-A2-CTB chimera, TcpA+CTB, TcpA, TcpA+FliC, CTB, FliC, or PBS.

Fecal pellets were collected from each mouse on days 21 and 42 for each immunization group, and fecal extracts were prepared. The amount of anti-TcpA IgA antibody (A) or anti-CTB IgA antibody (B) in each fecal extract was determined by ELISA and expressed as a fraction of the total IgA immunoglobulin in that extract. Each point represents data from one mouse, and each horizontal line represents the geometric mean value for the corresponding group. Statistical differences between groups were evaluated using ANOVA with the Tukey-Kramer post-test analysis (* indicates groups with P<0.05 versus all other d21 immunization groups not marked by *; # indicates P<0.05 versus all other d42 immunization groups except for the TcpA+CTB group).
