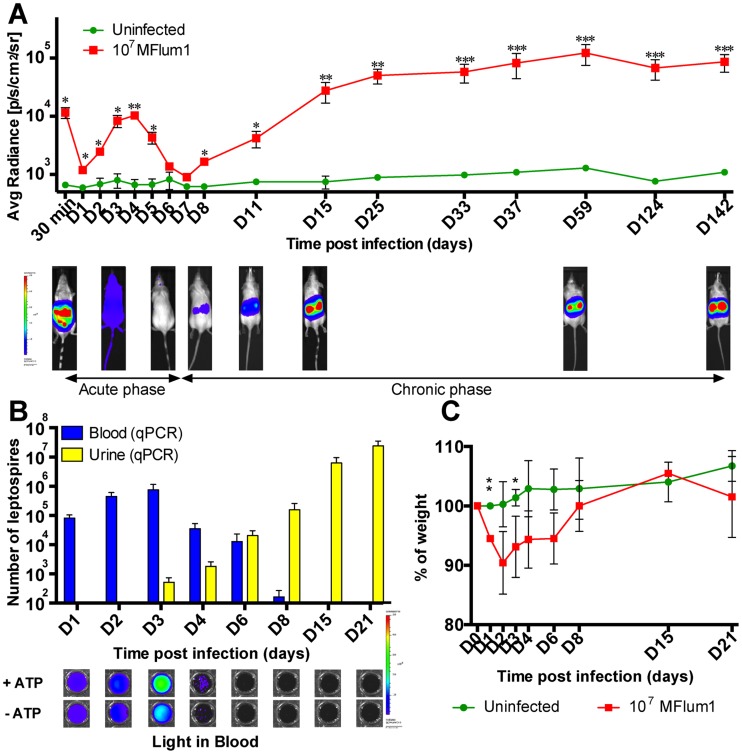
Figure 2. Kinetics of dissemination of bioluminescent MFlum1 in mice.
All the bioluminescence analyses were performed after IP administration or addition of D-luciferin. (A) Live imaging tracking of 107 MFlum1 IP injected to albino C57BL/6J mice. Images below the graph show the tracking of one infected mouse, photographed at different crucial time points. Data are expressed as the mean ± SEM of average radiance of light measured in photons/second/cm2 in n = 4 infected mice, imaged in the dorsal view, except for 30 min post-infection for which only imaging in the ventral view allows the visualization of the leptospiral dissemination in the peritoneal cavity. p values (*p<0.05, **p<0.01, ***p<0.001) between infected and uninfected groups. Images depict photographs overlaid with color representations of luminescence intensity, measured in photons/second/cm2 as indicated on the scales, where red is the most intense and purple the least intense. (B) Kinetics of leptospiral quantification by q-PCR in blood and urine of albino C57BL/6J mice infected with 107 MFlum1. Below are shown corresponding images of the ex vivo live imaging of MFLum1 in blood, in the presence or absence of ATP. (C) Monitoring expressed as the percentage of weight loss of mice infected or not with 107 MFlum1. Panels B and C are representative of 2 independent experiments with a total of n = 8 mice for each group. p values (*p<0.05, **p<0.01) between infected and uninfected groups.

