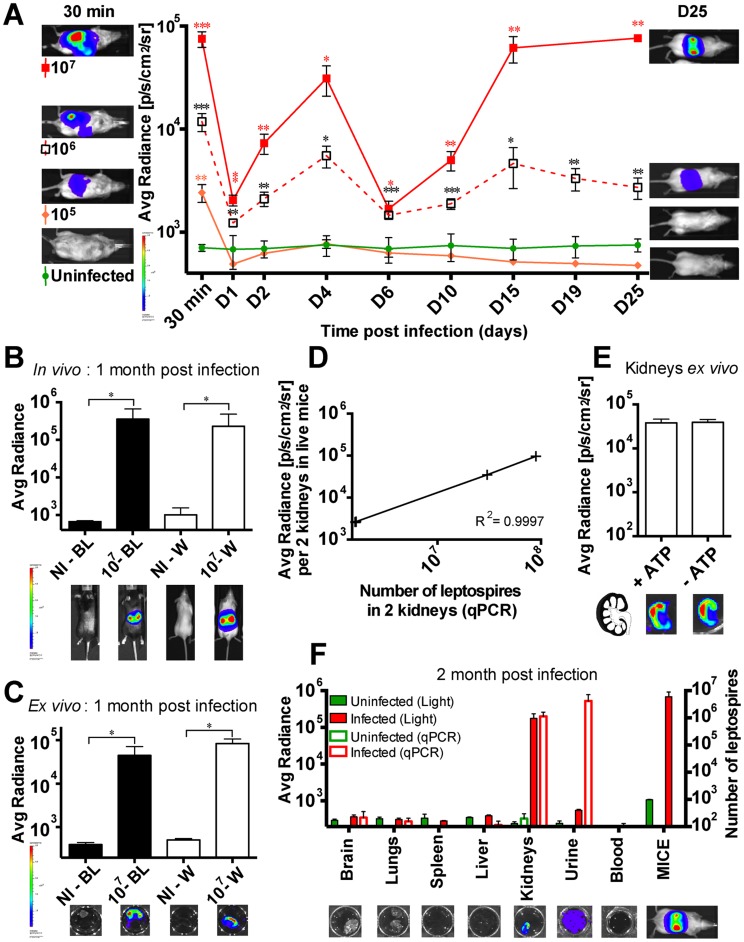
Figure 3. Threshold of infective dose of MFlum1 to obtain renal colonization.
(A) Comparison of the dissemination kinetics for MFlum1 injected to albino C57BL/6J at different doses. Data are expressed as the mean ± SEM of average radiance of light measured in photons/second/cm2 in n = 4 infected mice, imaged in the dorsal view, except for 30 min post-infection for which only imaging in the ventral view allows the visualization of the leptospiral dissemination in the peritoneal cavity. On the right side are shown images of one representative mouse at 30 min post infection as a control of infection and on the left side, images of one representative mouse at the end of the kinetics. p values (*p<0.05, **p<0.01, ***p<0.001) are indicated in corresponding colors for each group versus the uninfected group. In vivo (B) and ex vivo (C) live imaging and quantification of albino (W) and black (BL) C57BL/6J mice one month post infection with (107) or without (NI) 107 MFlum1. Bioluminescence imaging in dorsal view was carried out after dorsal shaving of the black mice. Below are shown corresponding images of live mice gated on the kidneys (B) and ex vivo (C) tracking of half-kidneys after sacrifice and addition of D-luciferin. p value (*p<0.05) between infected and uninfected groups n = 4 mice per group. (D) Correlation between renal imaging and q-PCR. Bioluminescence imaging at 25 dpi in dorsal view of live chronically infected C57BL/6J mice (from 106 or 107 experiments), gated on the kidneys. Subsequently, mice were euthanized and kidneys were harvested and further processed for determination of the leptospiral load by q-PCR. Each cross represents an individual mouse. (E) Ex vivo imaging in presence or absence of ATP of half-kidneys from 107 MFlum1 infected mice one month post infection. Data are expressed as the mean ± SEM of average radiance of light measured in photons/second/cm2 for 6 half-kidneys for each group. Below are shown corresponding images of the tracking of half-kidney after sacrifice and addition of D-luciferin. On the left is shown the schematic representation of an infected kidney in longitudinal cross section. (F) Ex vivo live imaging (Left Y axis) and the corresponding number of leptospires measured by q-PCR (Right Y axis) of different organs from 107 MFlum1 infected mice, one month post infection. Data are expressed as the mean ± SEM of average radiance of light measured in photons/second/cm2. This panel represents 2 experiments with a total of n = 6 mice infected with MFlum1, and n = 5 naïve mice. Below are shown corresponding images of the live imaging of one representative organ or fluid and a mouse before the sacrifice. For imaging, urine was pooled from several mice, to obtain a minimum volume of 50 µL.

