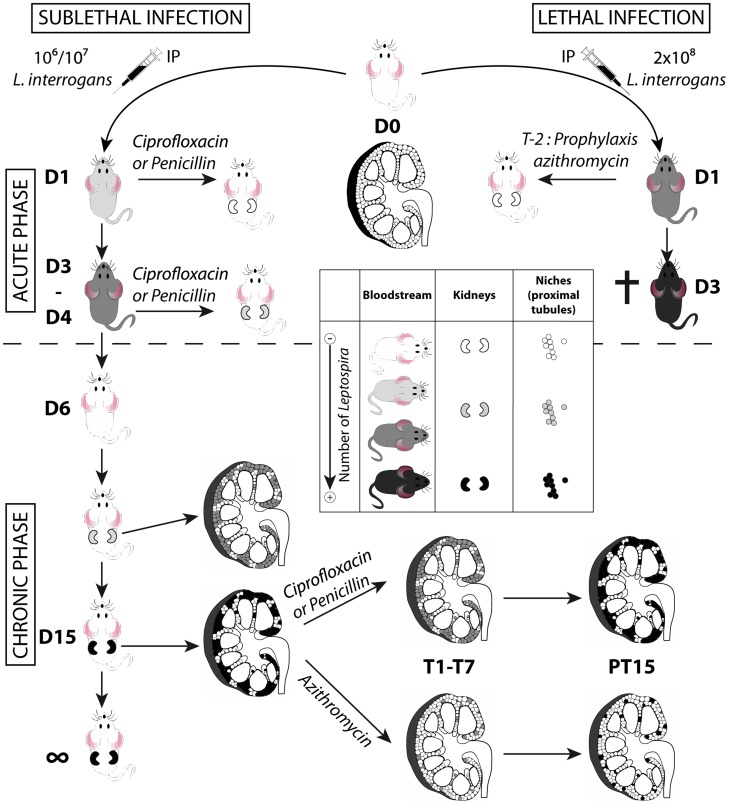
Figure 7. Model of acute and chronic leptospirosis in mice.
This figure depicts the course of leptospirosis in mice following an IP infection with a lethal dose of bioluminescent MFlum1, leading to a septicemia or with a sub-lethal dose leading to a chronic leptospirosis, and the effects of different antibiotics administered at the acute (upper part of the figure) or chronic phase (lower part of the figure) of the leptospiral infection. Mice depicted without kidneys represent mice at the acute phase of infection. Mice depicted with kidneys represent mice at the chronic phase. Inside the kidneys schemed in longitudinal cross-section, the niches colonized by leptospires, presumably the proximal part of renal tubules (proximal tubules) are depicted by small circles. A grey color scale indicates the degree of leptospiral infection, where white means free of leptospires and black means a maximum of infection or colonization. The cross indicates that the mice died or were sacrificed because of acute leptospirosis. D1 to D15: days post-infection. T1-T7 duration of antibiotic treatments. PT15: 15 days post treatment. T-2 prophylaxis treatment 2 days prior to infection.

