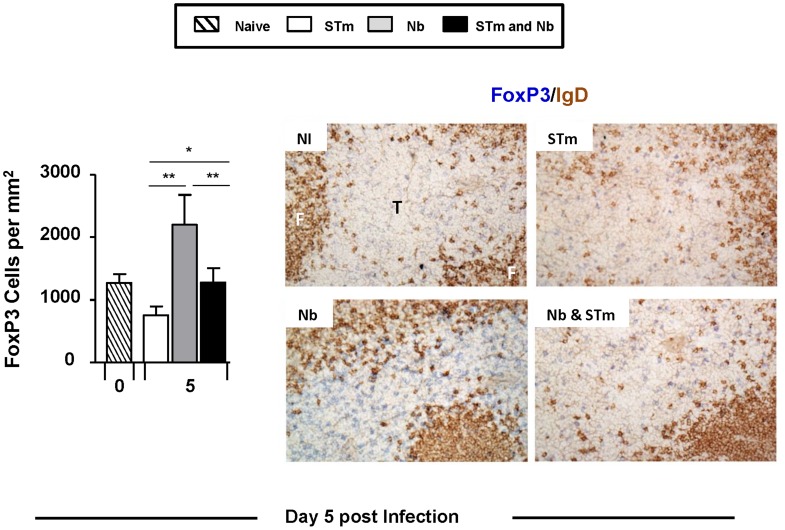
Figure 4. Co-infection alters the frequency of T-zone localised FoxP3 cells.
Spleen sections were generated for immunohistology at day 5 post-infection from mice which were infected as in Figure 1A. Sections were double-stained for FoxP3 with CD3. These sections were then used to quantify FoxP3+CD3+ T cells in the T-zone per mm2. Representative images show double-staining with FoxP3 (blue) and IgD (brown) with images acquired using a Leica microscope DM6000 using a 20× objective. Infections with STm and Nb were administered intraperitoneally and subcutaneously respectively. Data is representative of 4–6 mice per group with experiments performed twice for each time point. T = T zone; F = B cell follicle (*P<0.05 and **P<0.005).

