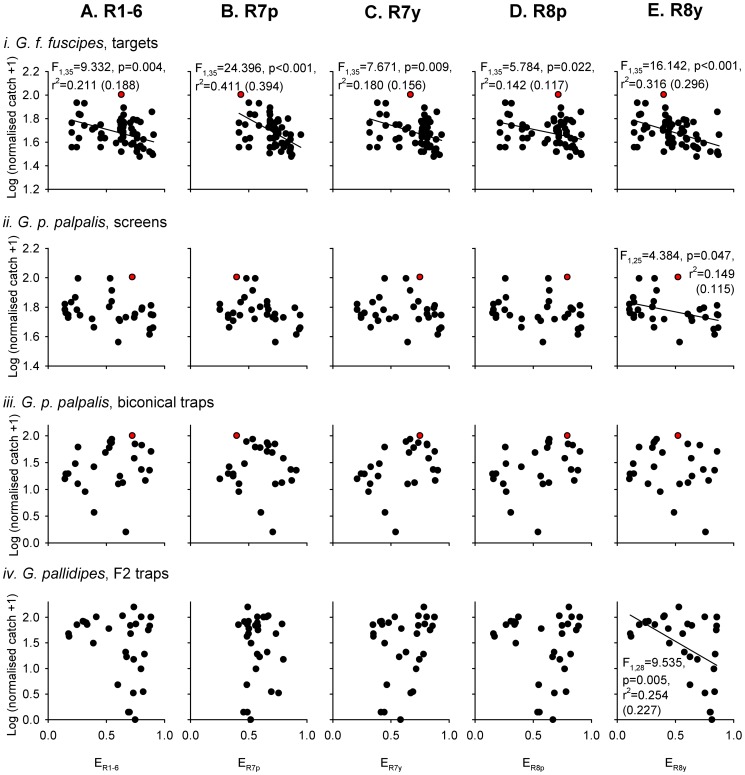
Figure 3. Female tsetse fly catches, and photoreceptor excitations, elicited by a range of visual baits.
Female tsetse fly catches were obtained from three published field studies [5], [7], [11], as in Fig. 2, and have been log-transformed for analysis as in that figure. Data for the standard, phthalogen blue bait are indicated by the red data point in (i)–(iii). Tsetse catches are plotted against excitations calculated for each of the five main types of fly photoreceptor (A–E), based upon the reflectance spectra of visual baits used in the original studies. In each plot, data points are tsetse catches for every visual bait presentation in the original studies, but linear regression analyses were conducted on a reduced dataset in which each visual bait was represented once (against its mean normalised tsetse fly catch). The outcomes of statistical analyses are indicated where a significant relationship was identified (with adjusted r2 value in brackets). Sample sizes are as for Fig. 2.

