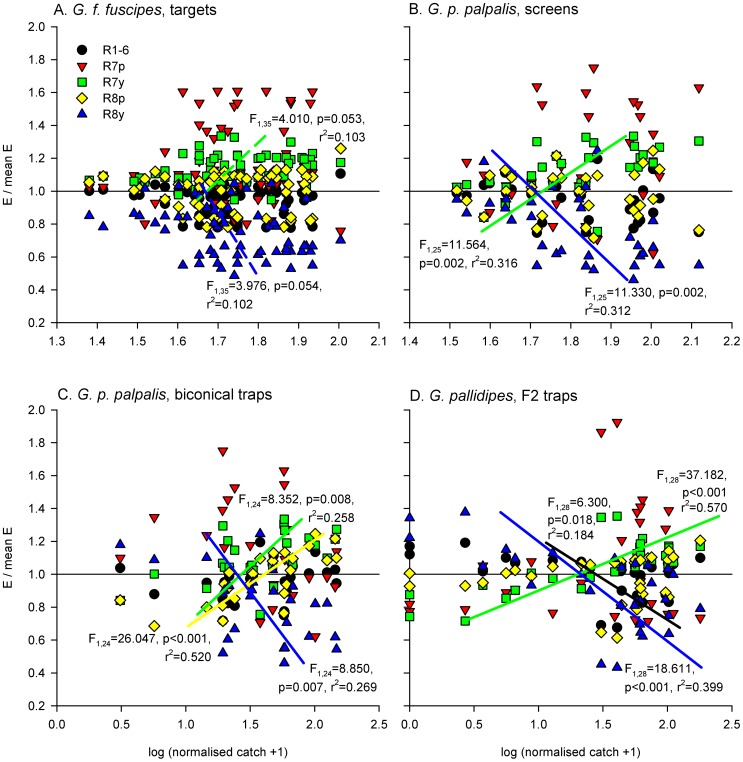
Figure 4. Male tsetse fly catches, and relative excitations of each photoreceptor type, elicited by visual baits.
Here, calculated photoreceptor excitations for each visual bait are expressed as a proportion of the mean excitation across all five photoreceptor types to that same bait, and plotted against log-transformed normalised male tsetse fly catches across the four experiments (A–D). In each plot, the horizontal black line indicates mean excitation across all photoreceptor types. Log-transformed tsetse fly catches were regressed against normalised excitations for each photoreceptor type, and significant relationships are indicated. Note that the relationships indicated by dotted lines in panel A were not significant at p<0.05, but have been included for comparison across datasets. Other non-significant relationships have not been plotted. Sample sizes for data plots and statistical analyses as stated for Fig. 2.

