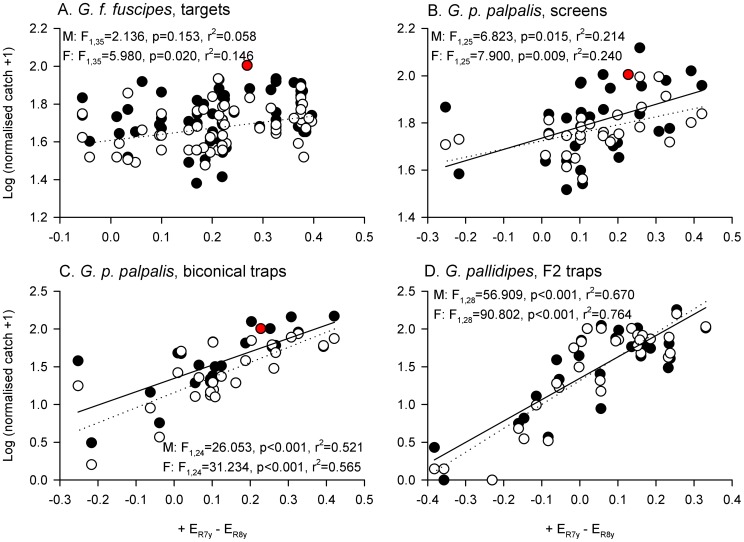
Figure 6. An opponent interaction between R7y and R8y is a good predictor of tsetse fly catches.
The opponent interaction is calculated as + ER7y – ER8y, and log-transformed, normalised male (filled circles) and female tsetse fly catches (open circles), are plotted against it. Fitted lines indicate significant relationships (p<0.05) for males (solid lines) and females (dotted lines), as determined by linear regression (see figure for details; note that the relationship for males in panel A was not significant). Red data points indicate phthalogen blue visual baits, which were not characterised by extreme values of this opponency index. Sample sizes for data plots and statistical analyses as stated in Fig. 2.

