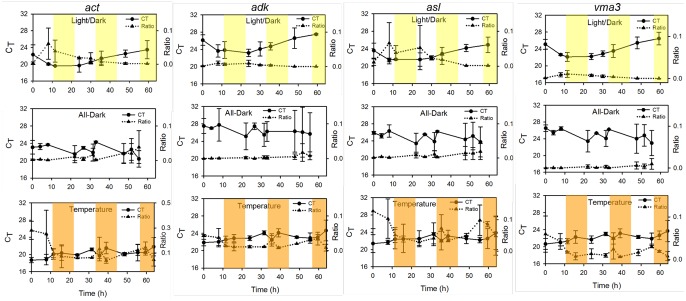
Figure 5. Correlation between gene expression and CT values as derived from absolute quantification of transcript and gene copy numbers.
Standard curves were created for the act, adk, asl, and vma3 genes and used to calculate the transcript-to-gene ratios under conditions of light/dark cycling, temperature fluctuation, and continuous darkness. Top panel depicts light/dark cycling, with yellow highlight indicating light on. Bottom panel displays conditions of temperature flux between 25°C and 37°C, with 37°C illustrated by orange highlight.

