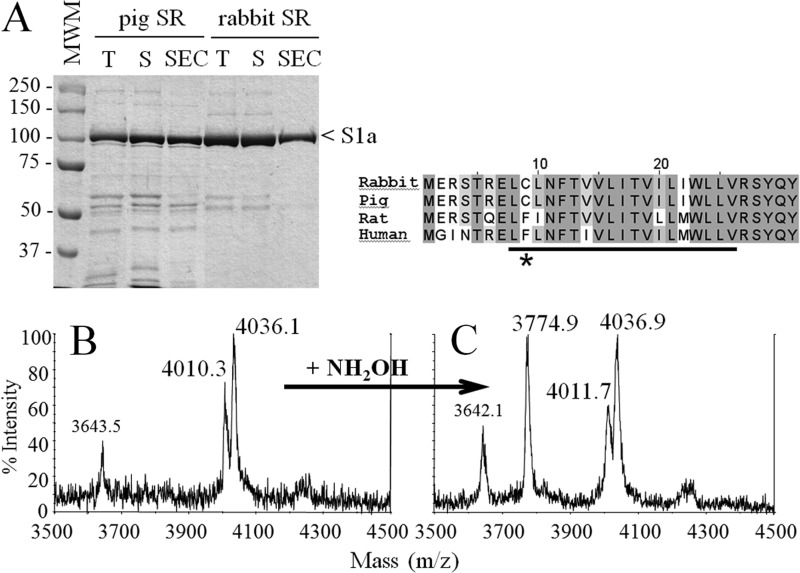
FIGURE 4.
Analysis of pig SR. Purification of the putative pig SERCA1a-SLN complex was achieved as for the rabbit SR (see procedure for Fig. 1). A, Coomassie Blue stained SDS-PAGE of the purified samples. T corresponds to the total fraction before solubilization by DDM, S corresponds to the supernatant, which contains solubilized proteins after centrifugation, SEC corresponds to the SEC-purified fraction that contains the purified SERCA1a-SLN complex. S1a indicates SERCA1a. In pig SR, the minor band running immediately below the Ca2+-ATPase is phosphorylase, not present in the rabbit sample because the latter were fasting 1 day before sacrifice (54). The molecular weight marker (MWM) used was Prestained Plus Precision All Blue Standard from Bio-Rad. Samples were loaded on a 8% Laemmli type Tris-glycine SDS-PAGE. B and C, MS analysis of the SEC-purified DDM-solubilized pig SR without or with treatment with NH2OH (panels B and C, respectively). Spectra were acquired either on a large range of masses as in Fig. 2 (i.e. on a m/z range going from 3000 to 140,000 Da) which allows simultaneous detection of SLN and of SERCA1a (data not shown) or on a smaller range, from 2000–6000 Da (only windows going from 3500 to 4500 Da are shown here). Panel B corresponds to the untreated and panel C to the hydroxylamine-treated sample. The peak at 3643 Da is likely to be an impurity, in line with the less pure pig SR. Right inset, sequence alignment of rabbit, pig, rat, and human sarcolipin. Conserved amino acids are highlighted in gray. The asterisk indicates cysteine or phenylalanine at position 9. The transmembrane region expected to match with the hydrophobic part of the lipid bilayer is underlined (see also Fig. 6B).

