FIGURE 2.
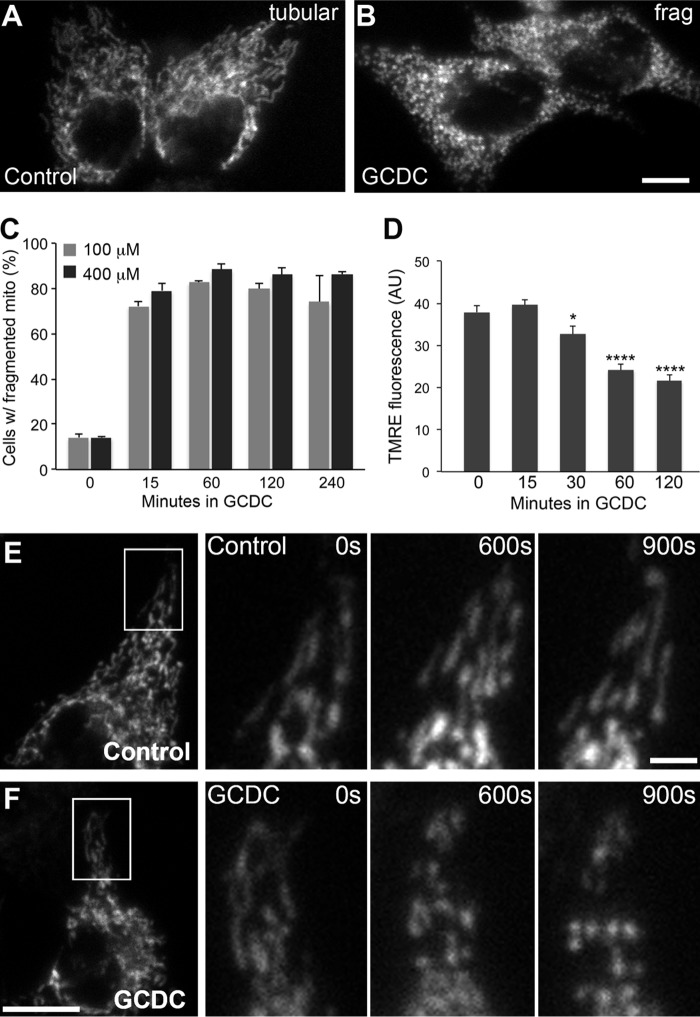
GCDC induces mitochondrial fragmentation in the bile transporter-expressing hepatic cell line McNtcp.24. A–C, mitochondria in McNtcp.24 are tubular in control conditions (A) and fragmented after GCDC treatment (B). Quantitative data show the numbers of cells with fragmented mitochondria increased to about 80% at 15 min and remained high with both 100 and 400 μm GCDC treatments (C). 100–200 cells were counted in each treatment; the experiment was repeated 3 times. Error bars are S.E. D, quantification of TMRE fluorescence shows a decrease in mitochondrial inner membrane potential at 30 min or longer treatments with GCDC. Error bars represent S.E. *, p < 0.05; ****, p < 0.0001. E and F, time-lapse imaging of mitochondrial in control cells (E) and GCDC-treated cells (F). Mitochondria remained tubular under control conditions (E) whereas mitochondrial tubules became shorter at 10 min and fragmented by 15 min after GCDC addition (F). Scale bar: 10 μm.

