FIGURE 3.
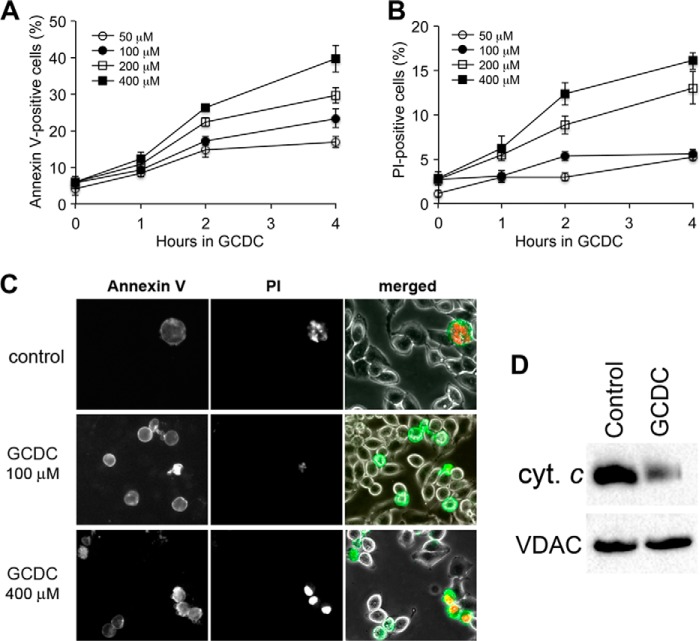
GCDC induces cell death in McNtcp.24 cells. A and B, GCDC-induced cell death is time- and concentration-dependent as measured by annexin V (A) and PI (B). ∼400 cells were counted in each treatment; the experiment was repeated three times. Error bars are S.E. C, images of annexin V and PI staining. Cells positive for annexin V are PI-negative at a low concentration of GCDC (100 μm) whereas annexin V-positive cells are PI-positive at a high-concentration of GCDC (400 μm). D, immunoblot of the mitochondrial fraction shows a significantly diminished cytochrome c level after 100 μm GCDC treatment for 2 h.

