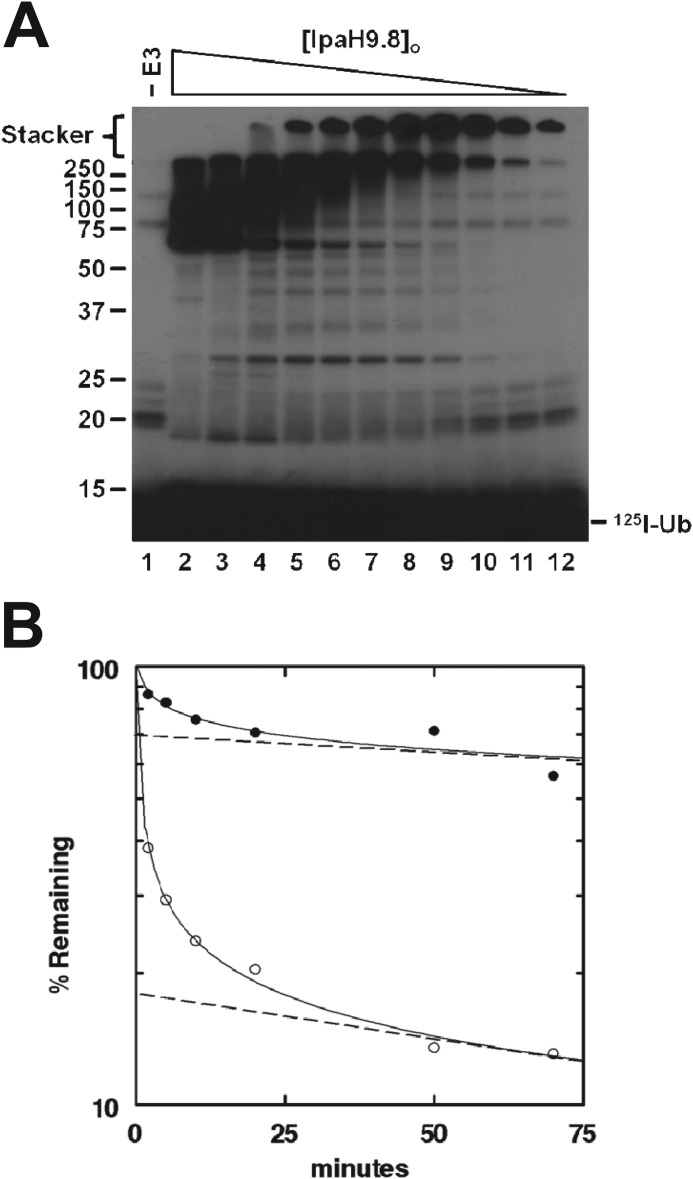
FIGURE 2.
IpaH9.8 concentration dependence for ubiquitin chain partitioning. A, autoradiogram of 125I-ubiquitin conjugation assays containing 15 nm Uba1 and 132 nm Ubc5A in the absence (lane 1) or presence (lanes 2–12) of varying amounts of IpaH9.8 (9.1 μm to 0.95 nm) were incubated for 10 min as described under “Materials and Methods.” Samples were resolved by 12% (w/v) SDS-PAGE and visualized by autoradiography. The mobility of relative molecular weight markers and position of the stacker gel are shown to the left. The position of free 125I-ubiquitin is shown to the right. B, 125I-ubiquitin conjugation reactions containing either 5 μm (closed circles) or 5 nm (open circles) IpaH9.8 were assayed for IsoT sensitivity as described in the legend to Fig. 1, B and C. The limiting rates for signal loss (dashed lines) were extrapolated to t0 in order graphically to determine the fraction of IsoT labile conjugates as the y intercept.

