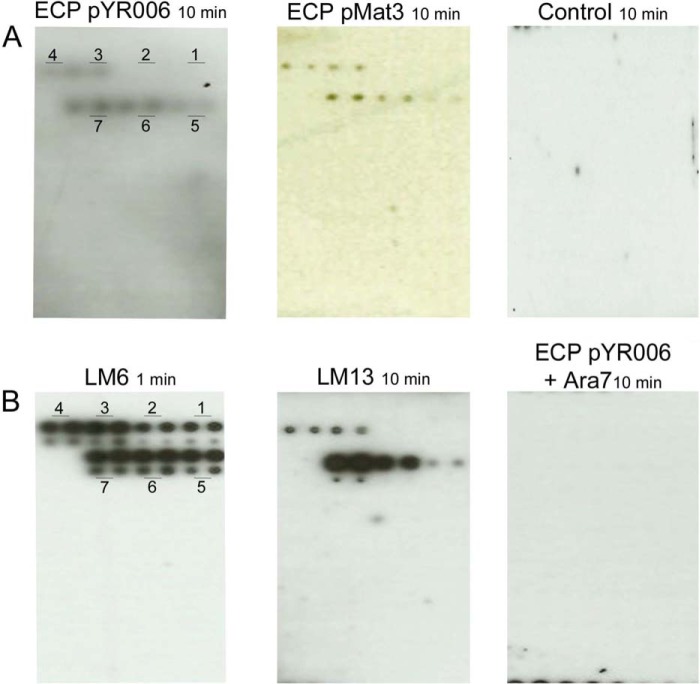
FIGURE 2.
Plant glycan interactions with ECP. A, plant glycan arrays comprising 36 defined oligosaccharides probed with purified ECPSakai (pYR006) or ECPIHE3034 (pMat3) detected with a specific anti-ECP antibody on ECL film. The negative control, no ECP, is also shown. The glycans are arranged on a grid pattern, each spotted four times, twice at 1 mg ml−1 (upper) and twice at 0.2 mg ml−1 (lower); refer to Table 4 for detail and a pictorial map. B, glycan arrays probed with anti-arabinan antibodies LM6 and LM13 or co-incubated with purified ECPSakai (pYR006) and Ara7. Numbers 1–7 refer to the number of arabinosyl residues in each oligosaccharide.

